

True financial health for a city goes far beyond having cash in the bank or balancing the budget. A financially healthy city must also be able to keep promises it already made.
Sacramento owns over 3,100 lane-miles of streets, plus the pipes, intersections, streetlights, fire hydrants, and parks alongside them, and it promises to maintain and replace these items forever. How can we best measure these promises? And are we on the right track towards fulfilling them?
The Tool
The Strong Towns Finance Decoder can help answer our questions. It’s a spreadsheet that pulls seven indicator metrics, commonly used by Canadian cities to measure financial health (a selection of indicators from PSAB SORP-4), out of a city’s annual financial report. Here they are:
- Formula: Current Assets – Total Liabilities
- What it is: The difference between the city’s financial assets (like cash and receivables) and its liabilities (like debt and pensions). This is the cumulative surplus/deficit that the city has accumulated through successive budget cycles.
- What it tells you: A positive net financial position suggests the city has more financial assets than obligations and is in a better position to weather downturns, invest in infrastructure, or respond to emergencies without resorting to borrowing or service cuts. If this number is negative, the city has spent more than it has saved and is relying on future revenue to pay past bills.
- What the trend shows: A downward trend means the city is growing more reliant on borrowing or deferring payments. An upward trend means it’s becoming more financially secure.
- Formula: Current Assets / Total Liabilities
- What it is: The city’s financial assets—such as cash, receivables, and other short-term holdings—divided by its total liabilities. This is a different way of presenting the Net Financial Position.
- What it tells you: This ratio shows whether the city has enough liquid financial resources to cover what it owes. A ratio below 1 means it would not be able to pay off its liabilities using only its financial assets, which is a sign of financial stress.
- What the trend shows: A rising trend means the city is improving its financial buffer. A falling trend suggests the city is becoming less able to handle its obligations without borrowing or cutting services.
- Formula: (Total Assets + Deferred Outflows) / Total Liabilities
- What it is: The value of all the city’s assets (including infrastructure) divided by its total liabilities.
- What it tells you: A ratio above 1 means the city owns more than it owes (solvent). Below 1 means it owes more than it owns (insolvent).
- What the trend shows: A downward trend means the city is becoming less solvent. An upward trend shows improving financial resilience.
- Formula: MAX(0, – (Net Financial Position) / Total Revenues)
- What it is: The total liabilities the city owes compared to how much revenue it collects in a year.
- What it tells you: This shows how many years of income it would take to pay off all debts if every dollar went to debt repayment.
- What the trend shows: If the ratio is rising, debt is growing faster than income—this is unsustainable. If it’s falling, the city is gaining control of its obligations.
- Formula: Interest Charges / Total Revenues
- What it is: The percentage of annual revenue spent on interest payments.
- What it tells you: This shows how much of the budget is consumed by past borrowing. The higher the percentage, the less room for services, maintenance, or investment.
- What the trend shows: An increasing trend limits future choices and can crowd out basic services. A decreasing trend improves flexibility and budget health.
- Formula: Net Book TCA / (Govt assets not depreciated + Govt assets being depreciated + Bus assets not depreciated + Bus assets being depreciated)
- What it is: The current value of the city’s physical assets compared to their original cost.
- What it tells you: This indicates how well the city is maintaining its infrastructure. A low value means assets are aging and wearing out.
- What the trend shows: A declining trend means the city is falling behind on maintenance. A stable or rising trend suggests it is keeping up.
- Formula: (Operating Grants & Contributions + Capital Grants & Contributions) / Total Revenues
- What it is: The share of the city’s income that comes from state or federal aid.
- What it tells you: High dependency on outside funding makes the city vulnerable to political or economic shifts beyond its control.
- What the trend shows: If the trend is rising, the city is becoming more dependent on outside help. If it’s falling, the city is strengthening its local revenue base.
We inserted 23 years of Sacramento’s reports (ACFR 2003-2025) into the spreadsheet, see results below! Most of the metrics look healthy (or recovering), but one important metric has been trending in the wrong direction and highlights the fatal flaw of the Suburban Experiment.
The Good
Let’s start with the metrics that look healthy or are trending towards healthy. In plain terms, these trends indicate that our ability to weather economic downturns and respond to emergencies is improving, our ability to pay for new things is improving, and we’re becoming more financially independent from the political whims of state and federal government. Great!
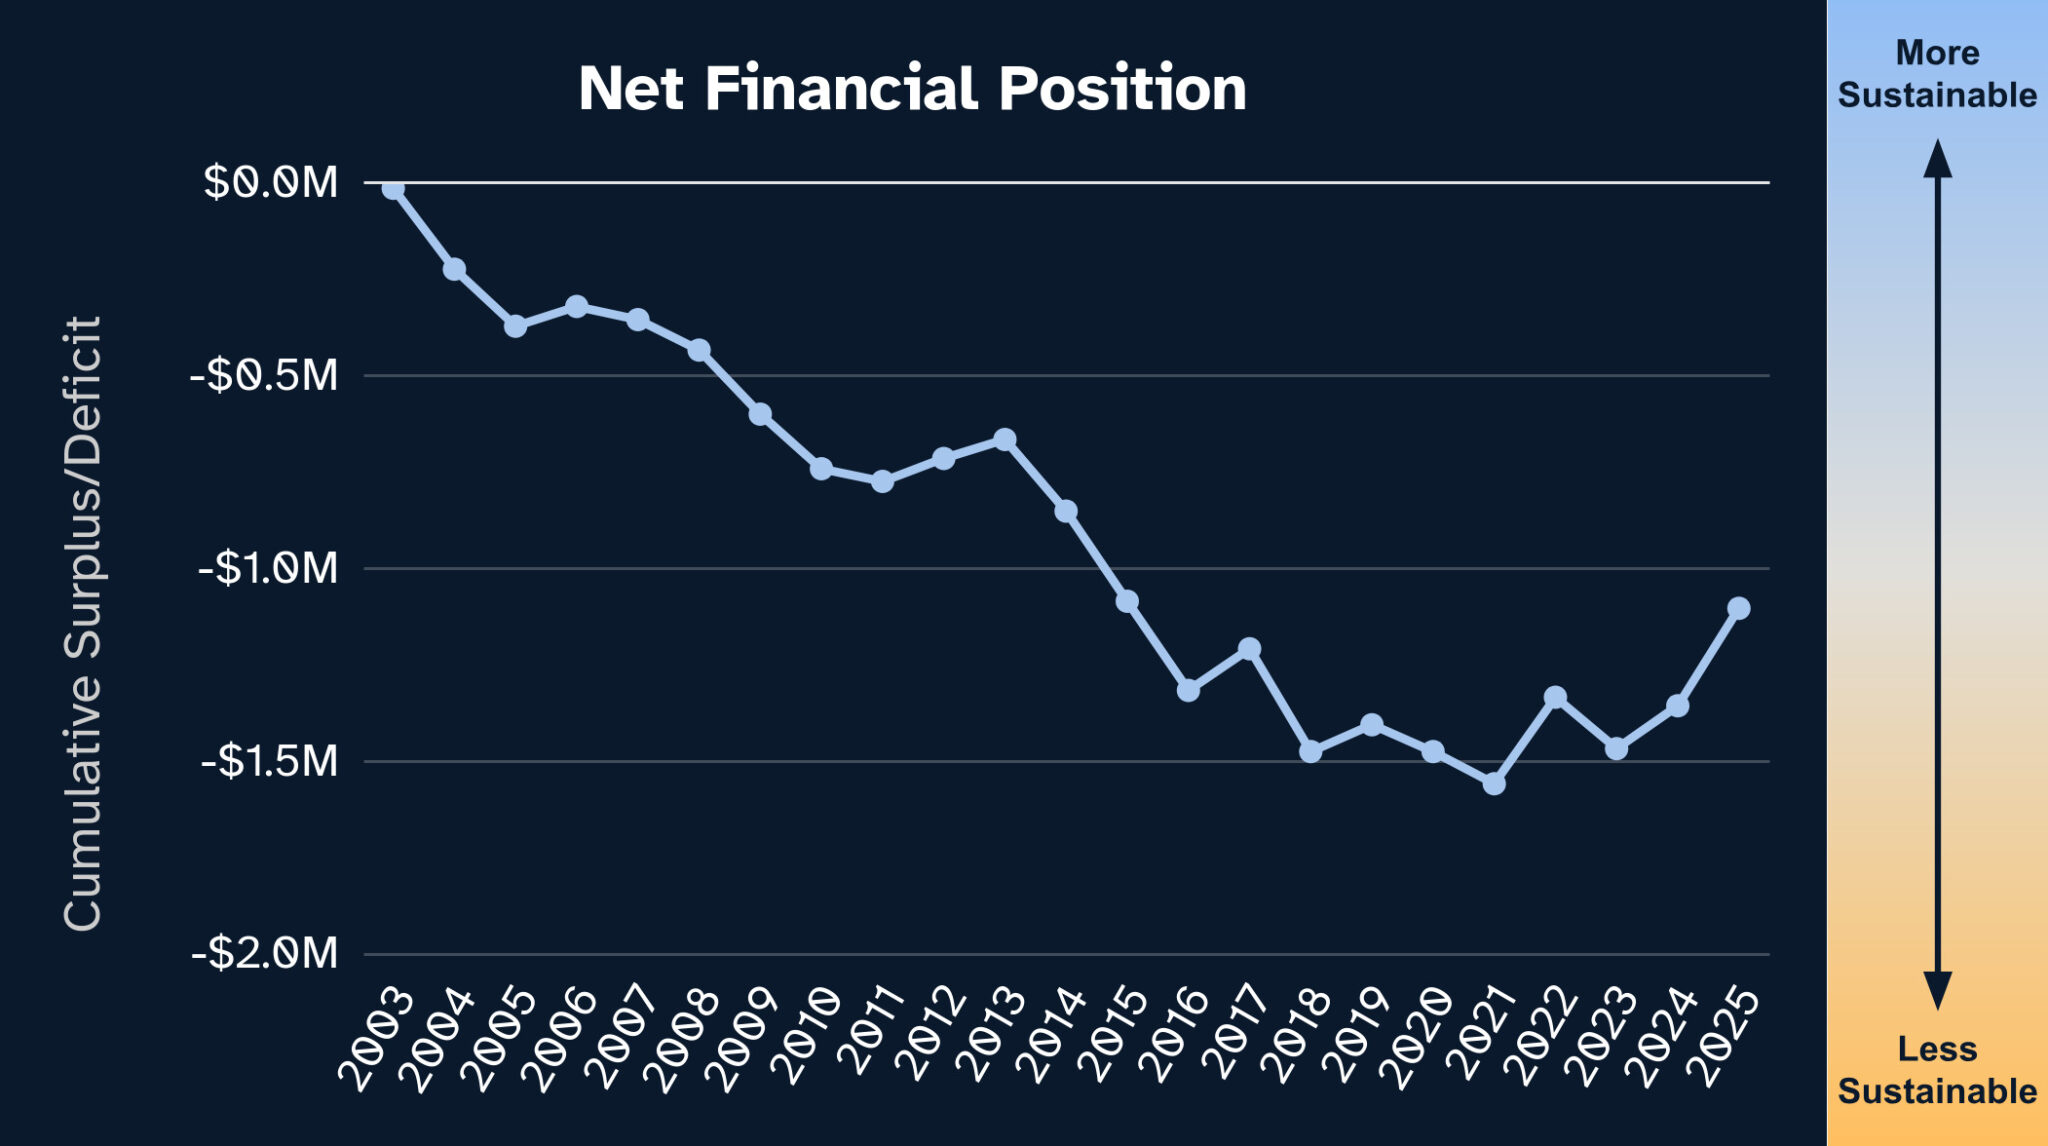
The Net Financial Position is the cash we have minus what we owe. According to this graph, we’ve spent more than we’ve saved and are relying on future revenue to pay past bills. The good news is that the last 3-5 years show some recovery.
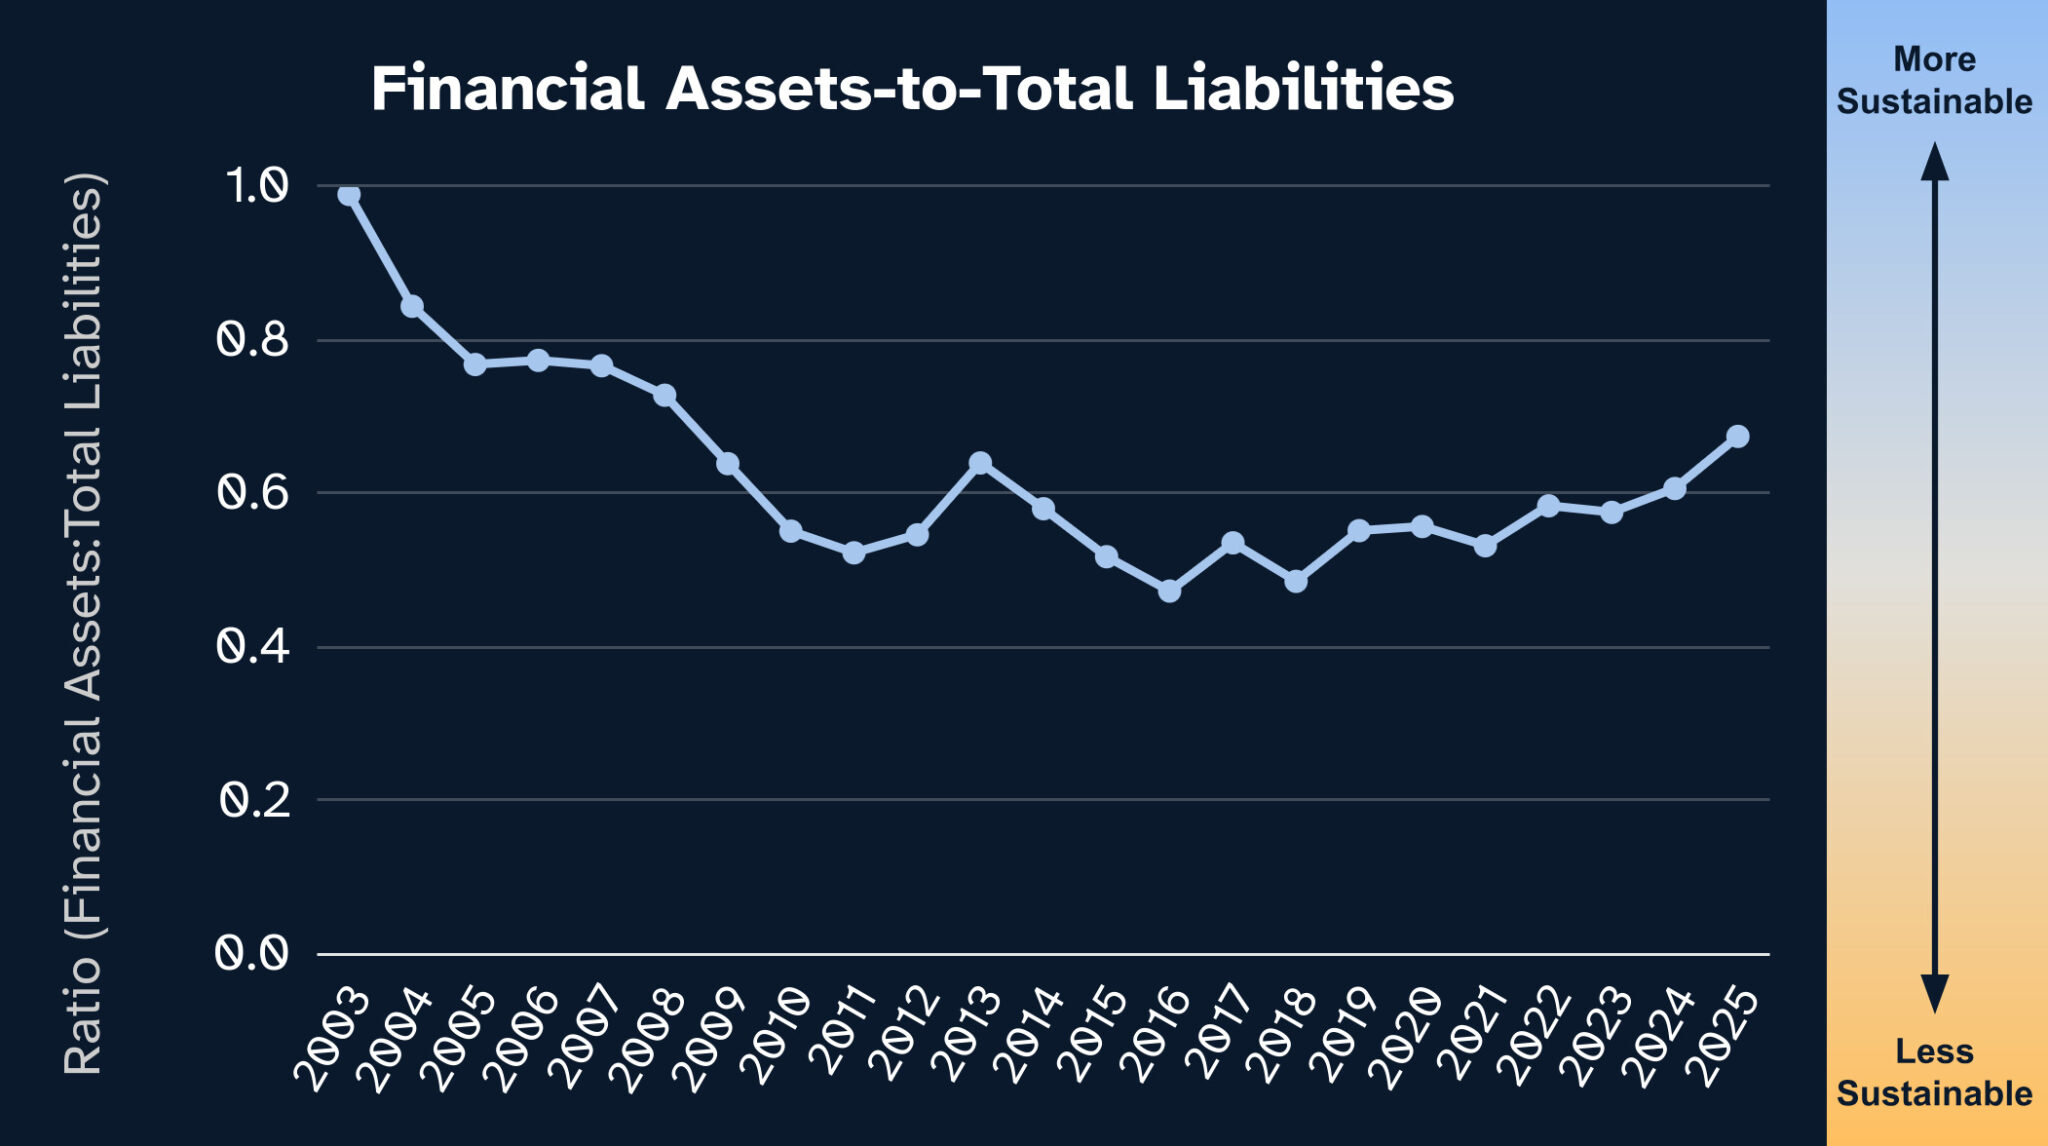
Financial Assets-to-Total Liabilities is the cash we have divided by what we owe. This is a different way of presenting the Net Financial Position. 1.0 or higher is ideal, but we’ve been slowly recovering since 2016.
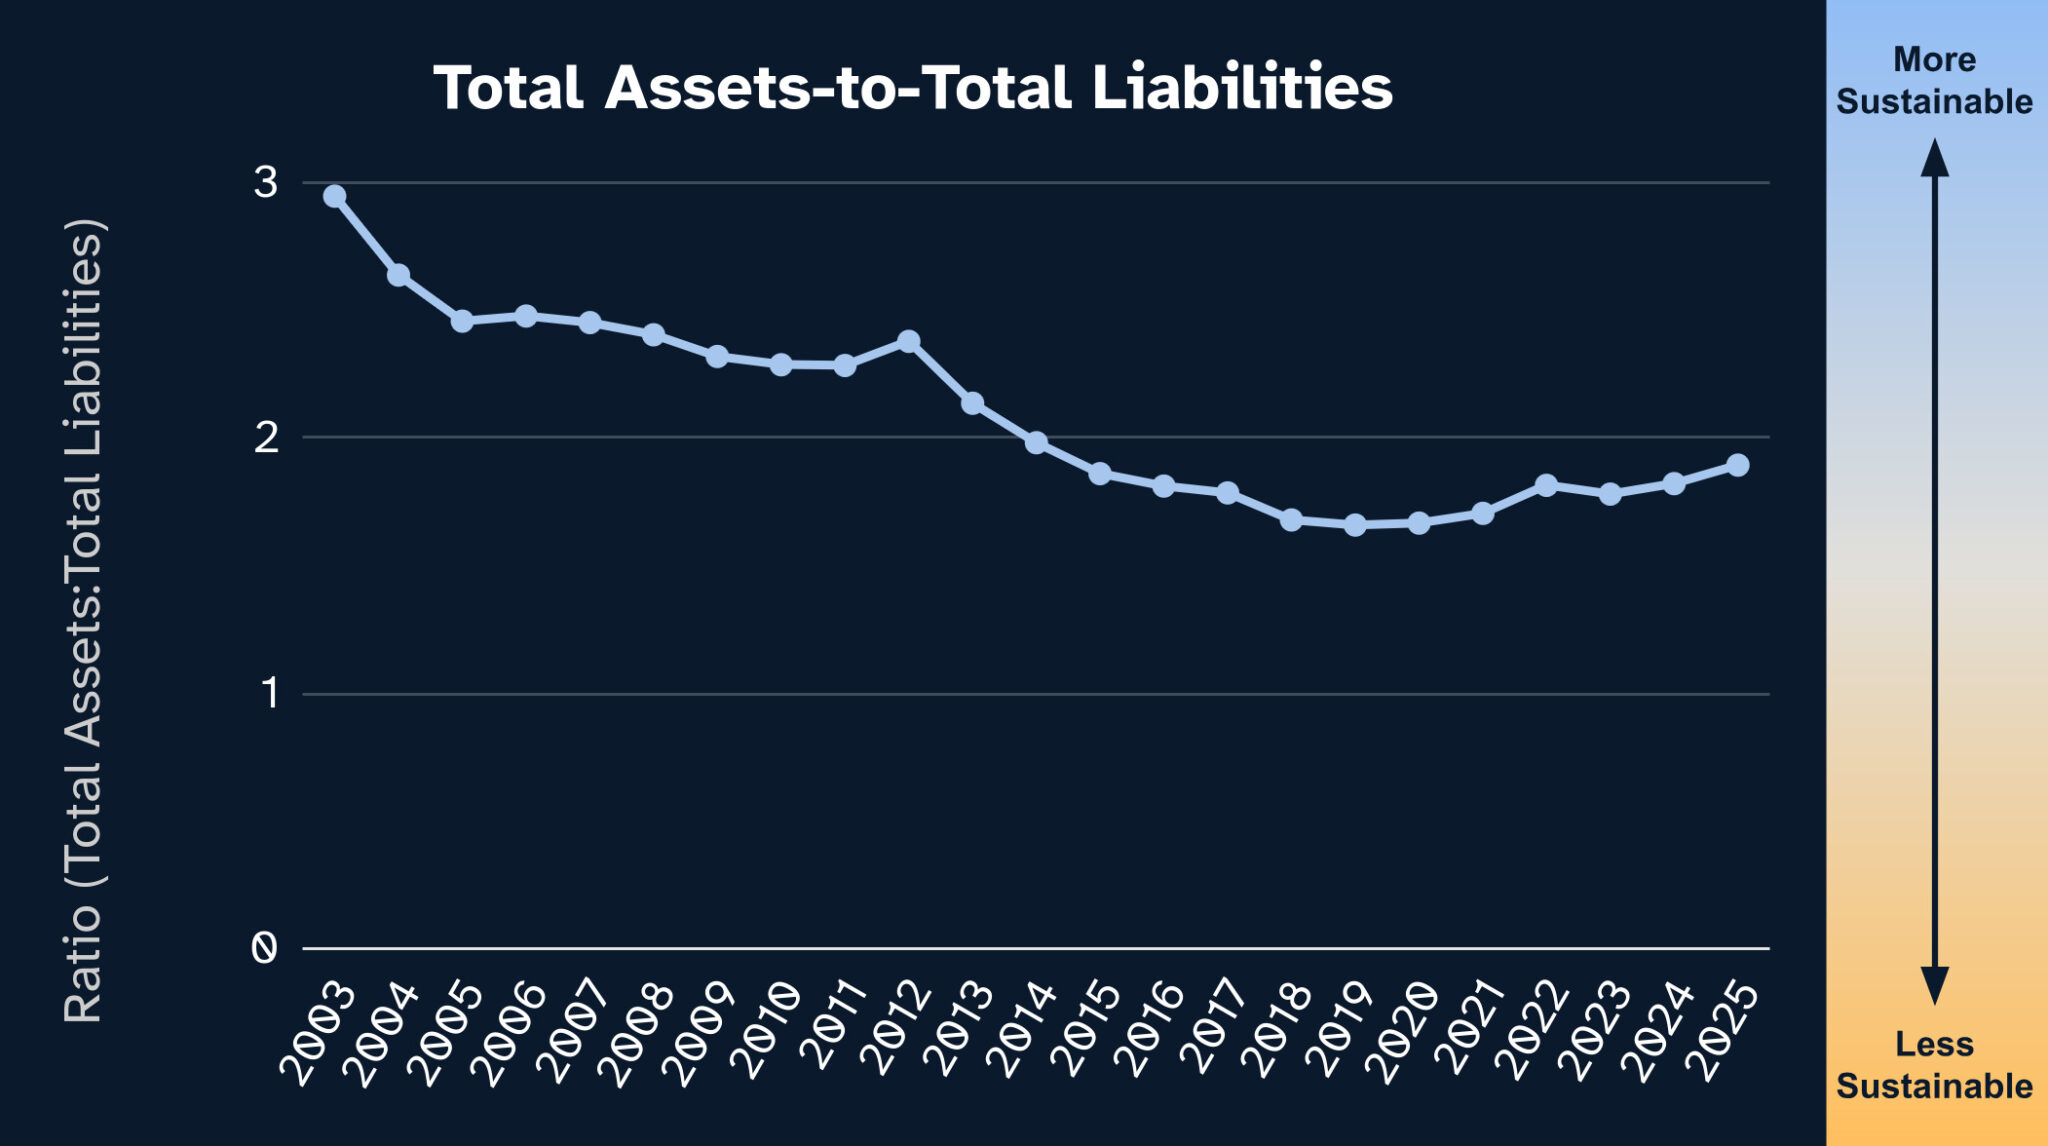
Total Assets-to-Total Liabilities is the value of all the city’s assets (including infrastructure) divided by its total liabilities. A ratio above 1.0 is good, and recent years show growth towards 2.0.
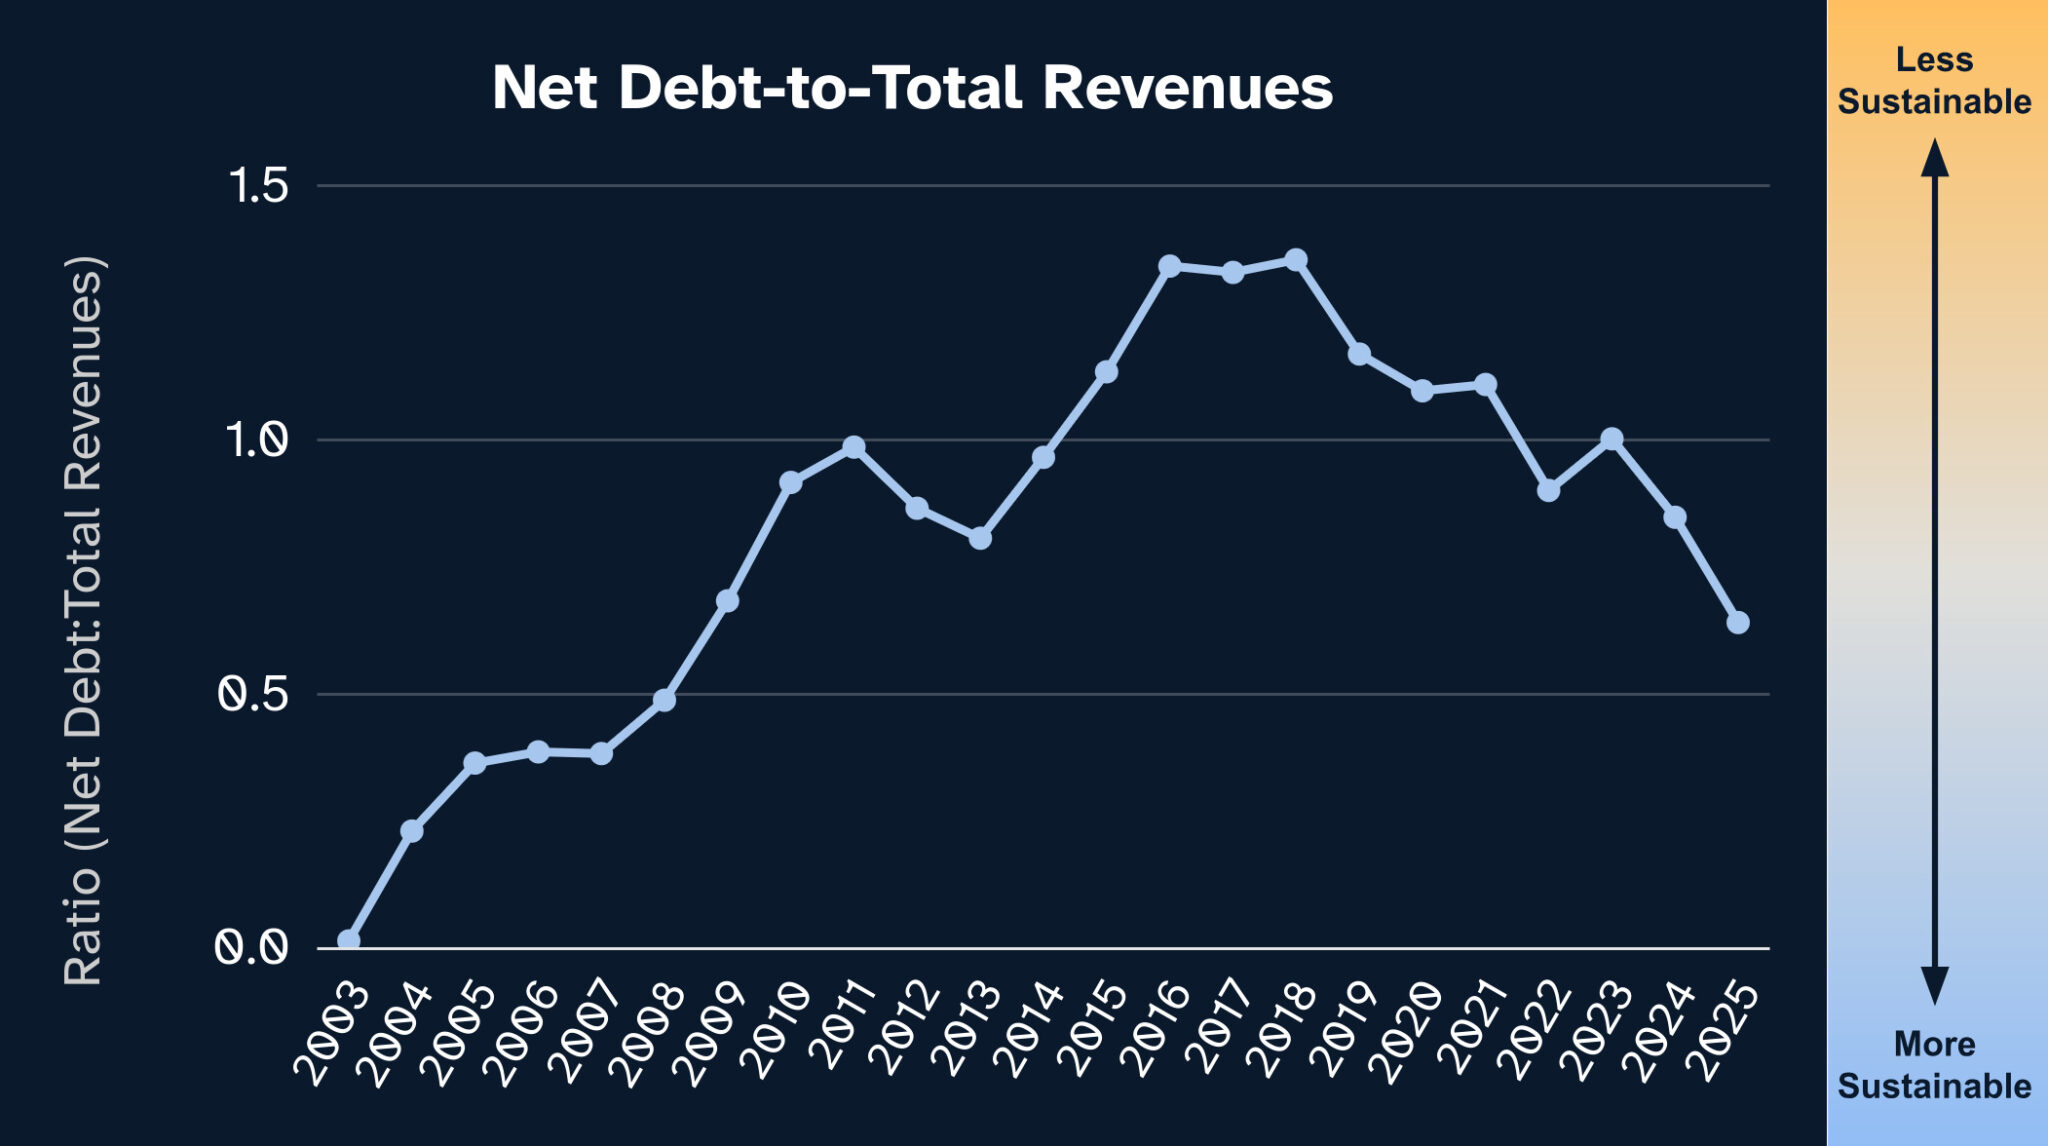
Net Debt-to-Total Revenues is what the city owes divided by its annual revenue. This shows how many years of income it would take to pay off all debts if every dollar went to debt repayment. This metric has been falling which means the city is gaining control of its obligations.
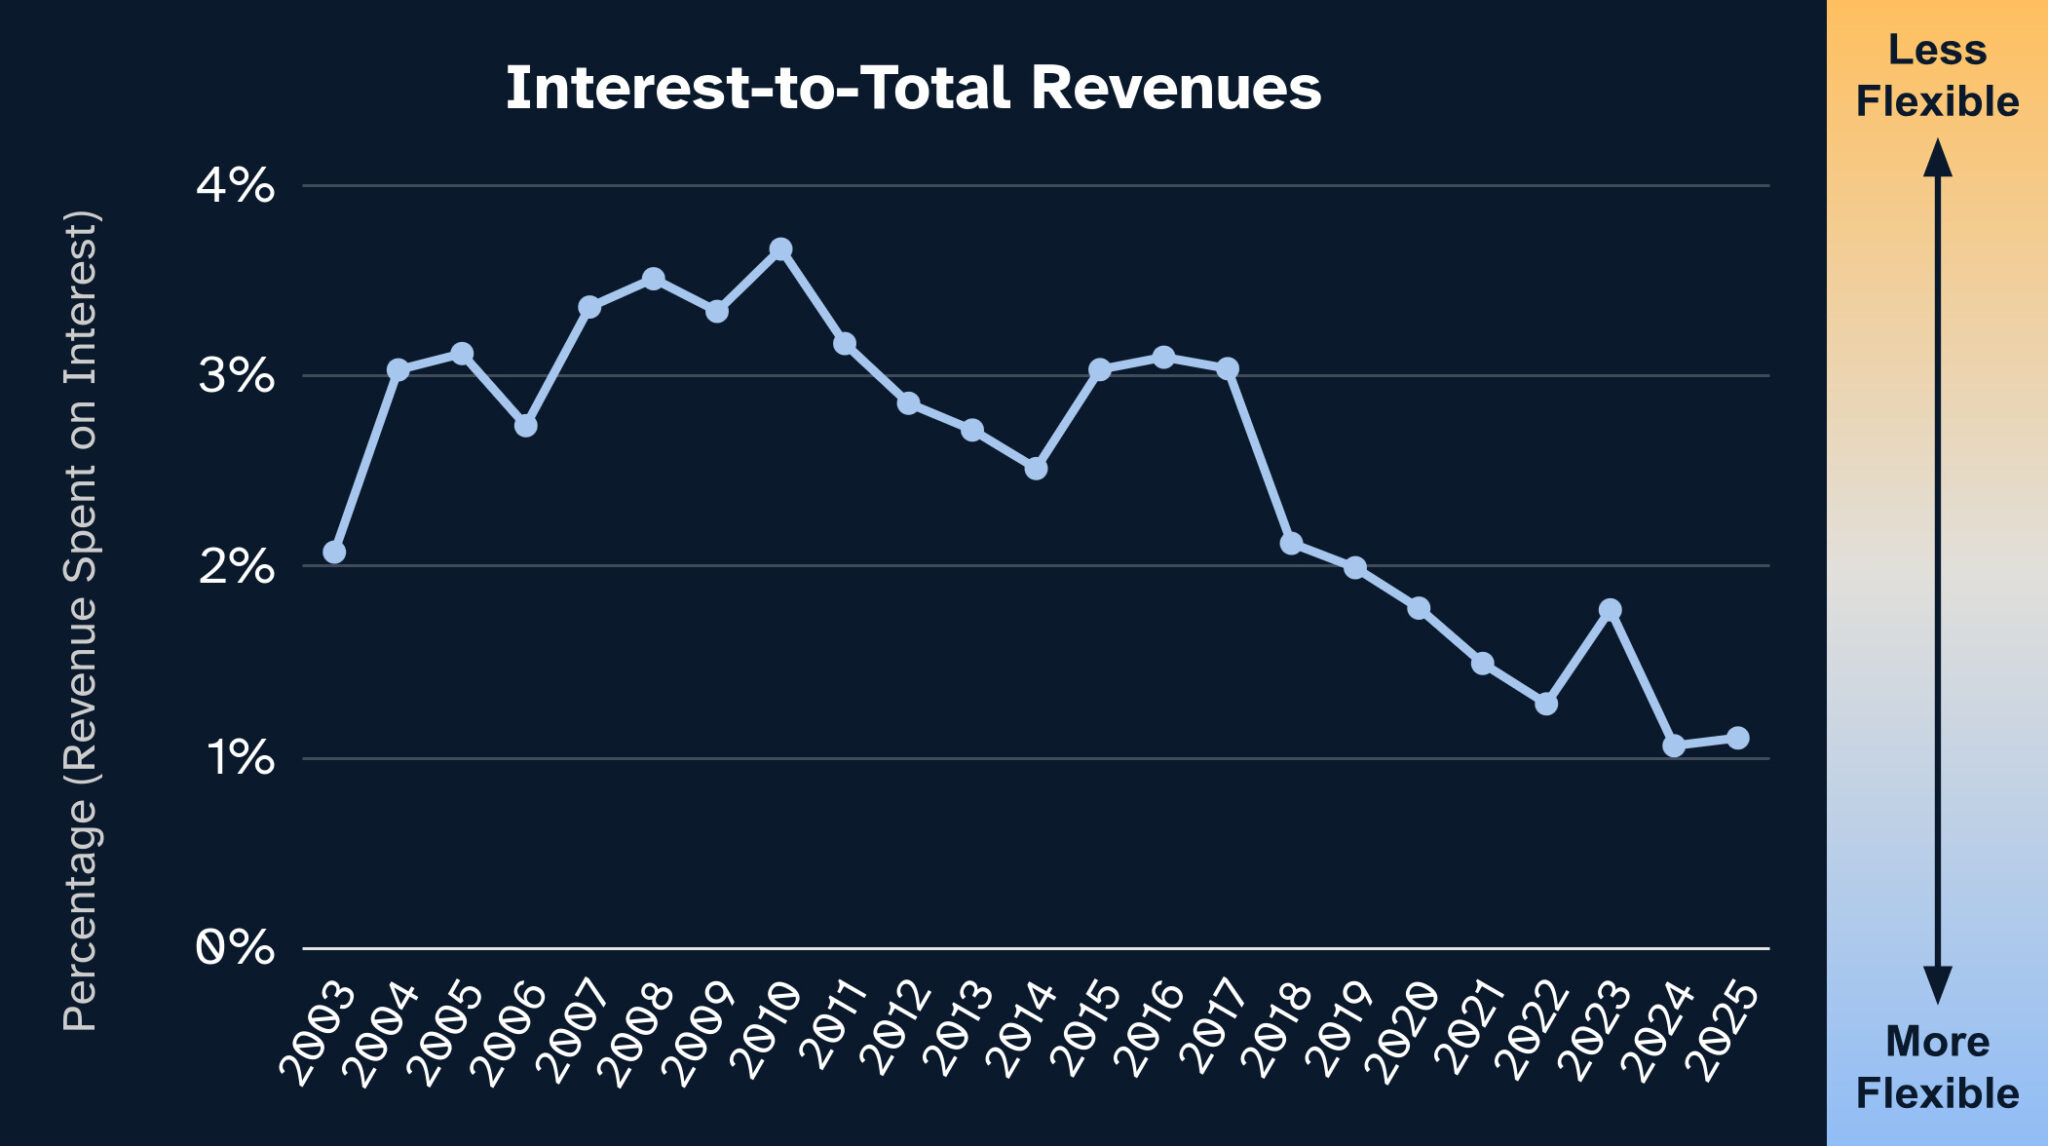
Interest-to-Total Revenues is the percentage of annual revenue spent on interest payments. A decreasing trend improves our ability to create new debt if needed, and overall improves flexibility.
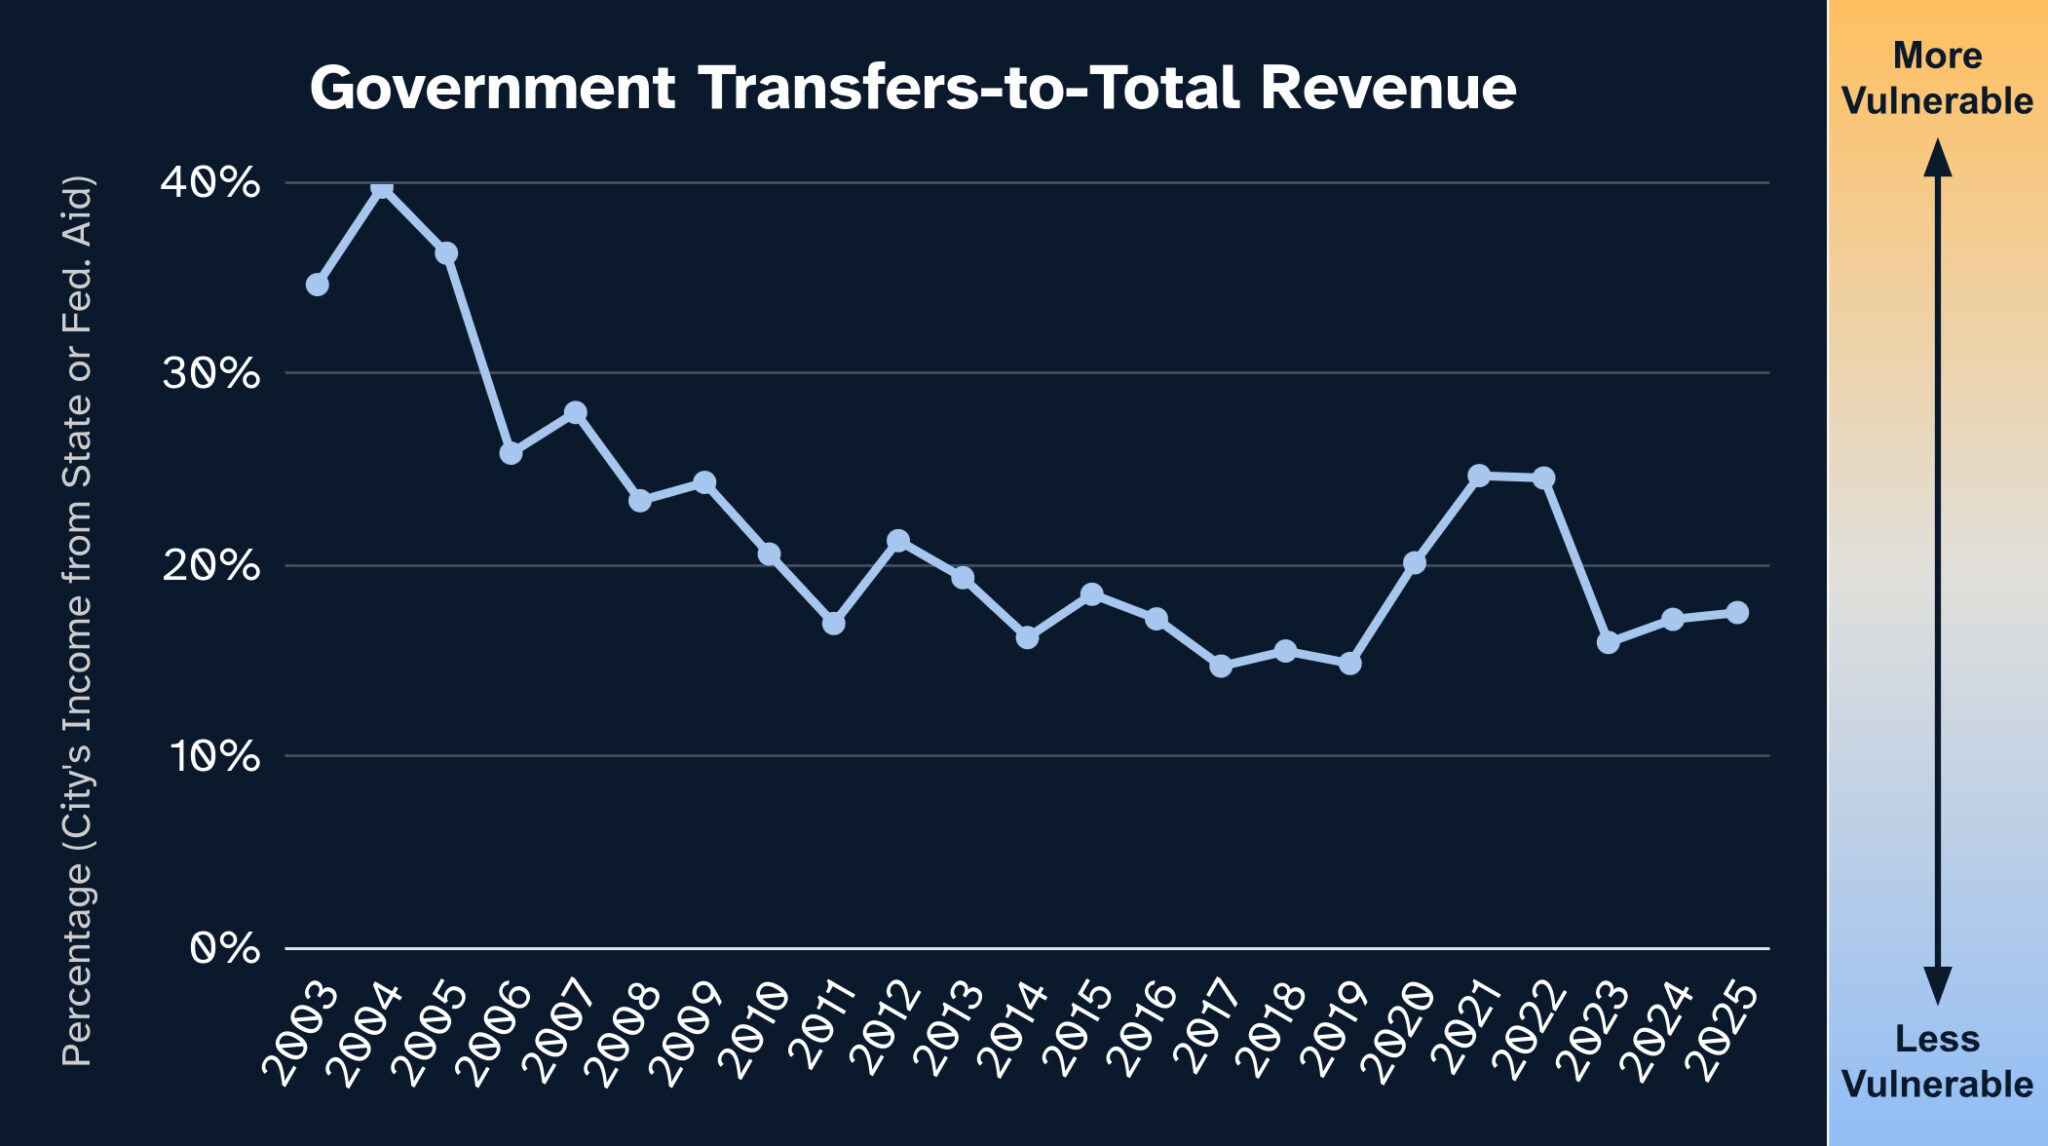
Government Transfers-to-Total Revenue is the share of the city’s income that comes from state or federal aid. 18% means Sacramento is highly dependent on outside funding, leaving the city vulnerable to political or economic shifts beyond its control. At least the metric has stabilized in recent years.
The Bad
When do you decide to replace your shoes? When they get scuffed? When the sole shows wear? Would you keep wearing them even after the sole begins to separate?
Sacramento is on track to let the soles fall off completely.
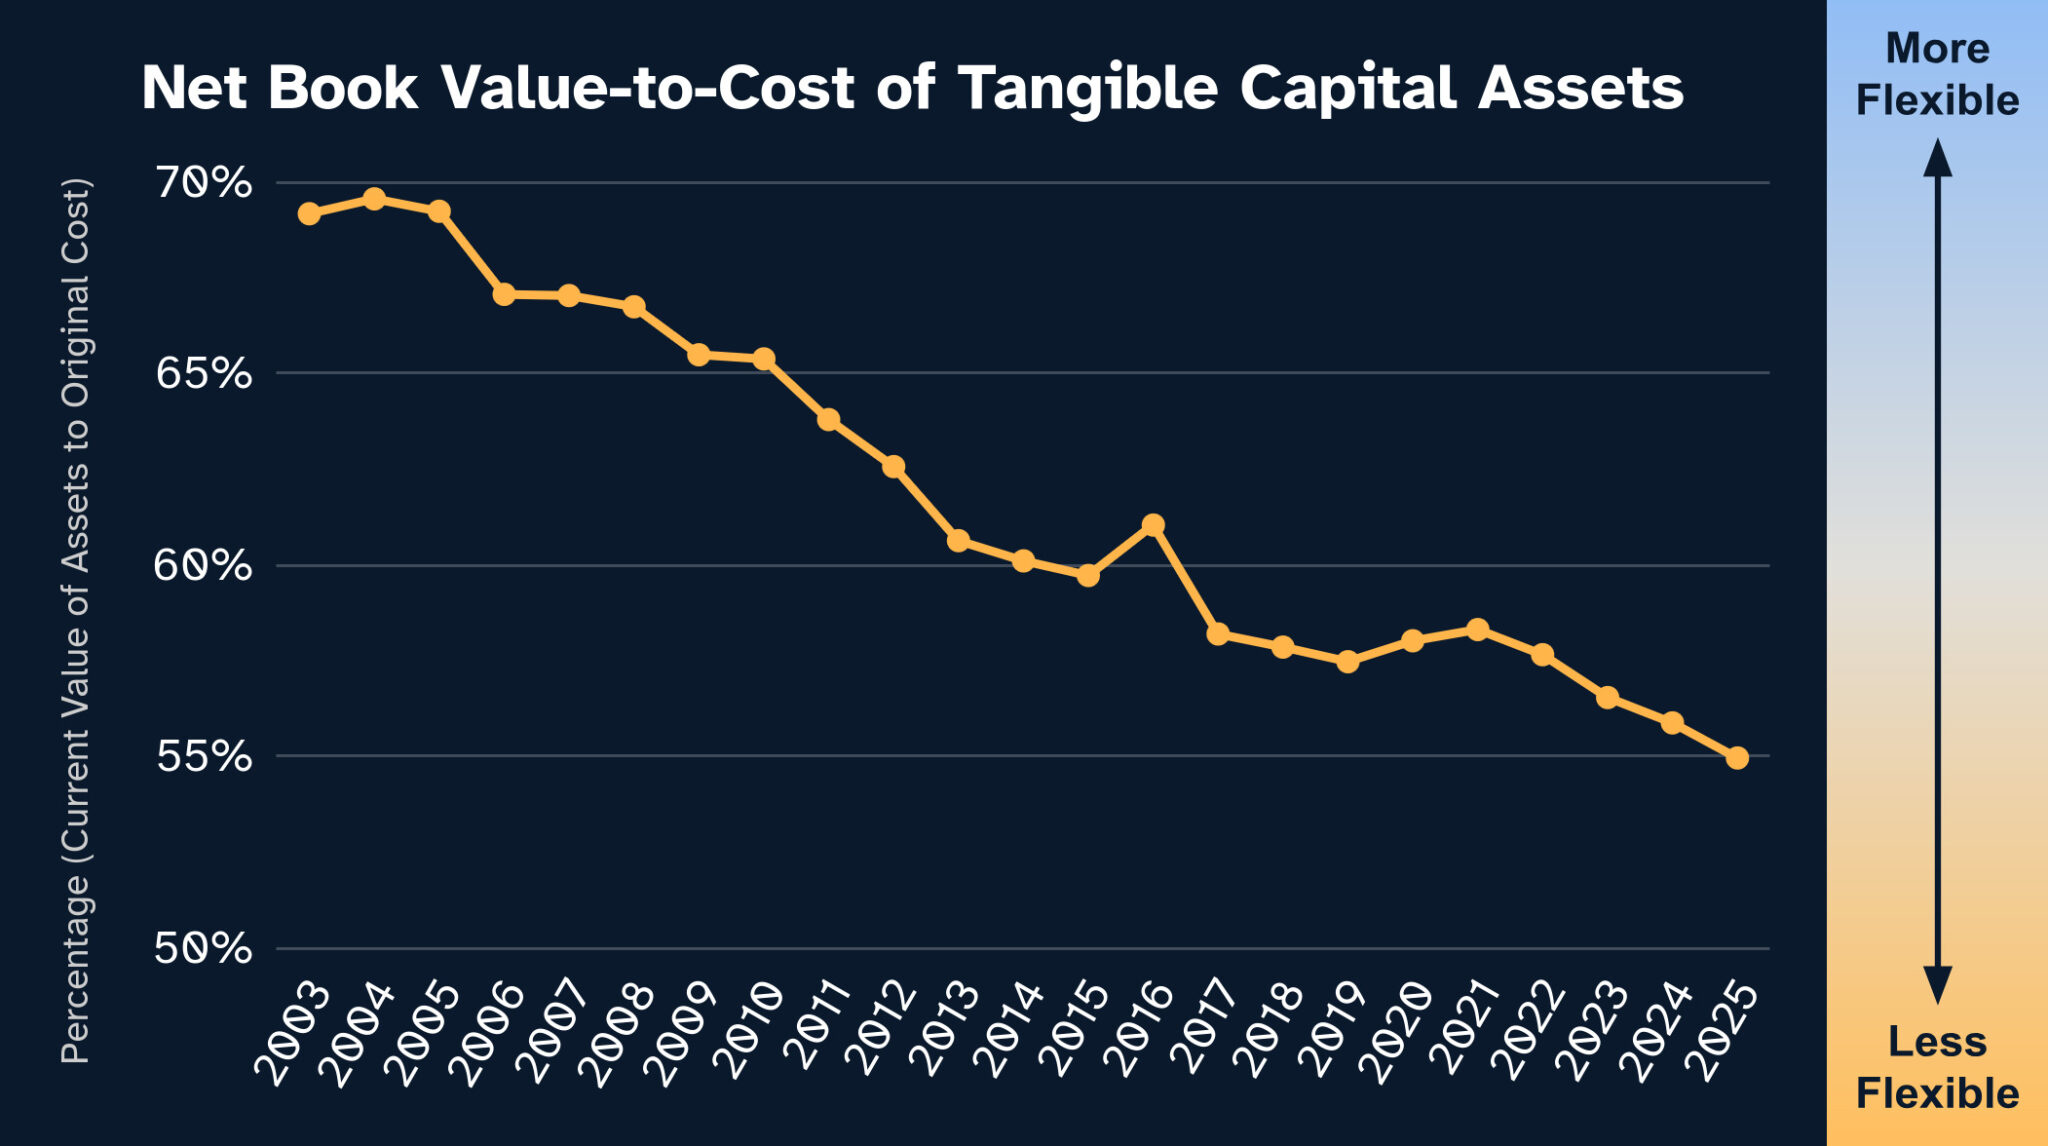
The Net Book Value-to-Cost of Tangible Capital Assets is the current value of the city’s physical assets compared to their original cost. How much useful life is left in what the city owns. This metric has been in steady decline over the last 2 decades.
People don’t experience a “net financial position” or a “debt-to-income ratio” in everyday life. People experience the faded crosswalk, the new pothole beside that older pothole, the dead streetlight that hasn’t been fixed since last year. This Net Book Value metric helps to put a number to those lived experiences.
The Ugly
55% net book value is still just an abstract number, so what does it actually mean concretely?
Sacramento uses the Pavement Condition Index (PCI) to measure the condition of street surfaces, where 25-49 is “Poor,” 50-69 is “Fair,” and 70-100 is “Excellent/Good.” Sacramento has an average PCI of 60 (“Fair”) compared to the statewide average of 65, but what’s more important is the trend:
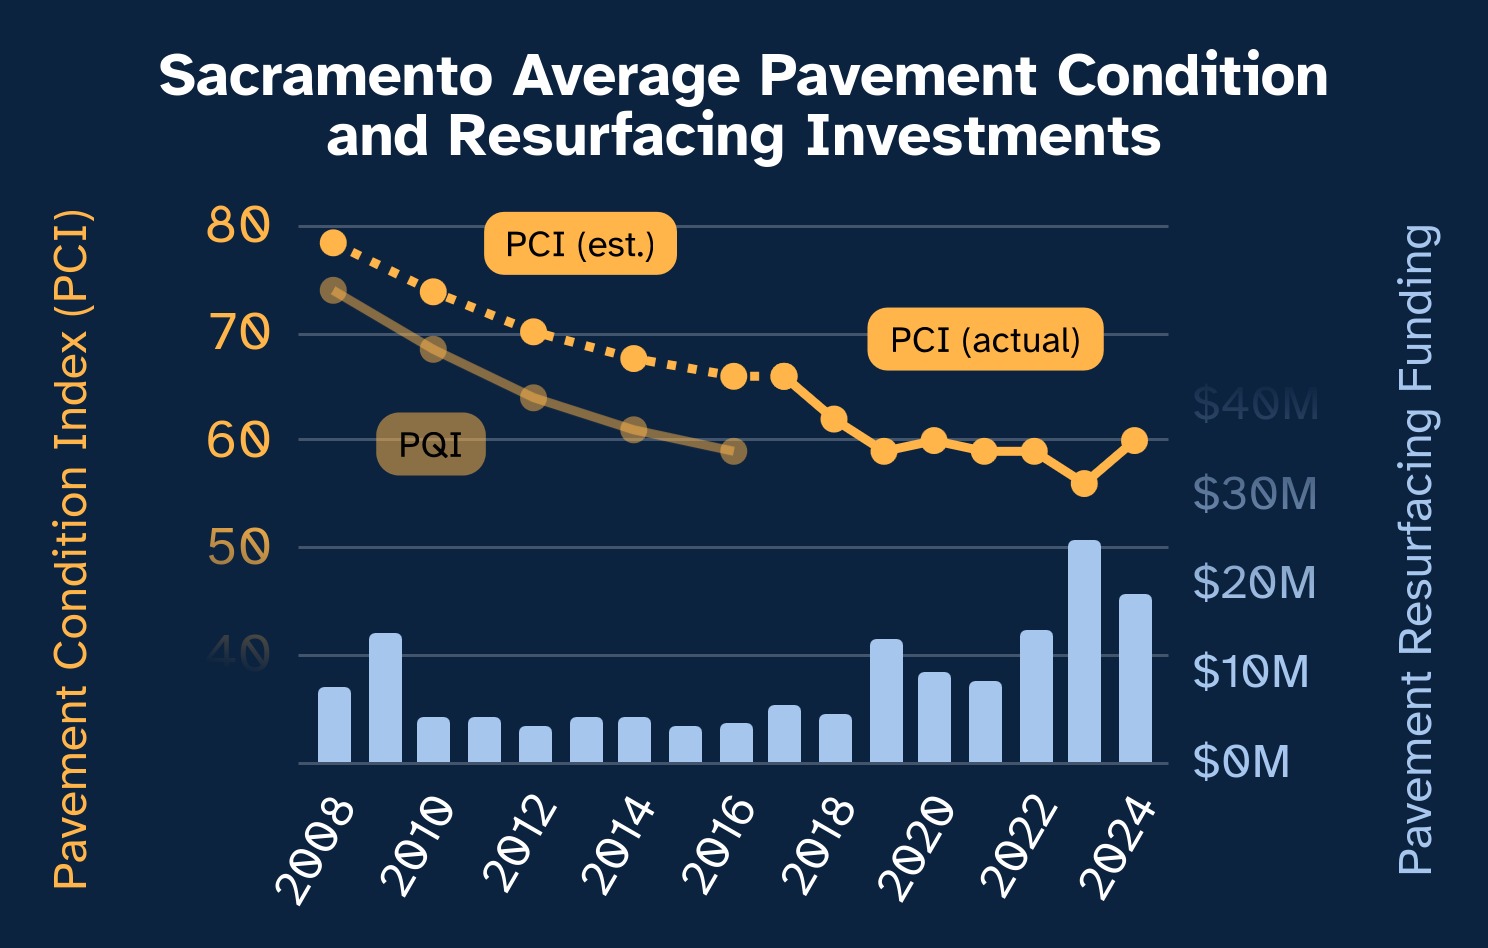
For 17 years, pavement conditions have been deteriorating. Even when investments substantially increased with pandemic-era state/federal aid, average pavement conditions did not improve.
The City’s projection of what’s to come is looking ugly:
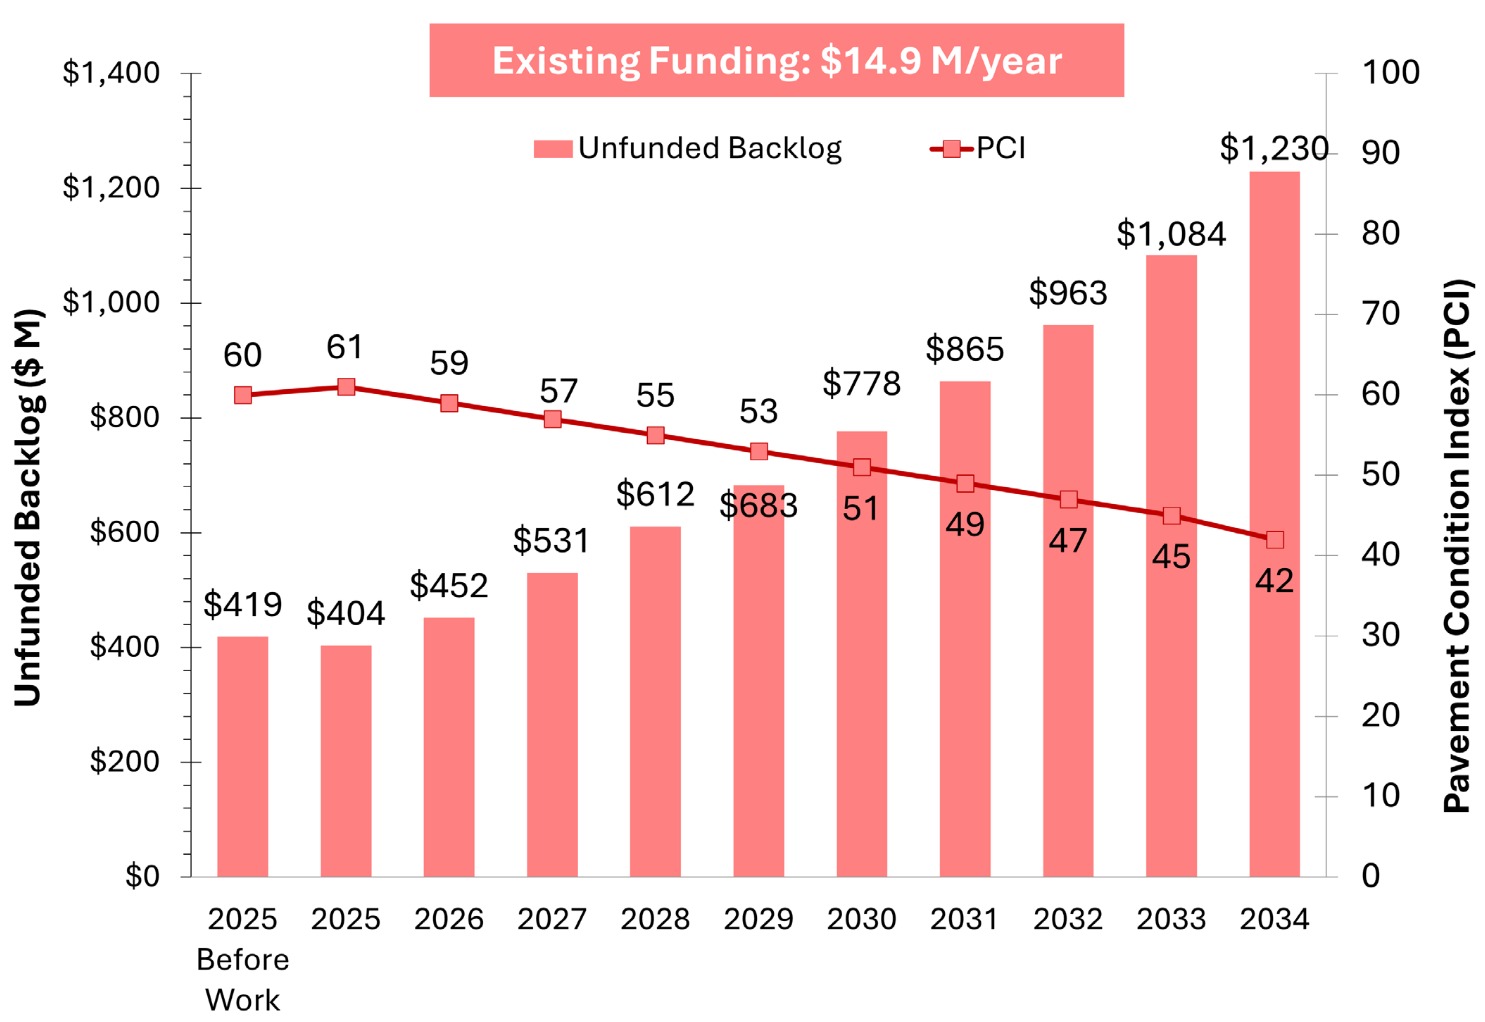
Not only will the pavement condition continue its free-fall, but the unfunded repair backlog will balloon from $419 million to about $1.2 billion by 2034 at current levels of investment. Our city has so many miles of roadway that even $14.9 million per year is not enough to avert pothole-pocalypse.
The Hole Gets Deeper
In addition to the physical deterioration of city infrastructure, the last few years of budget deficits have led to the elimination of over 100 vacant staff positions and have allowed the Economic Uncertainty Reserve (the rainy-day fund) to dip 8% below the minimum level. We continue to create future problems just to close today’s budget gaps.
Nevertheless, Sacramento’s leaders continue to approve new greenfield development and allow the construction of more public roadways and other maintenance liabilities. According to the City’s own financial reports, we expanded roadways by 139 lane-miles (4.5%) over the last decade. That’s over 1 billion pounds of material (asphalt + sub-grade), to give a sense of scale.
The Problem Is Hidden
Why would Sacramento leaders continue to approve new greenfield development and roadway expansions? Don’t they know new infrastructure can dig us deeper in the hole?
They don’t know because they haven’t been properly informed.
If you tried to look for that $419 million unfunded pavement maintenance backlog in the City’s financial reports, you wouldn’t find it because accounting rules don’t require deferred maintenance to be carried as a liability. In fact, none of the City’s crumbling infrastructure currently contributes to liabilities at all. Like most other US cities, Sacramento treats its infrastructure as an asset, a mistake that hides the true cost of unproductive suburban sprawl.
A true asset can be traded with other cities or seized by a creditor. However, infrastructure such as sidewalks and underground water pipes can’t realistically be traded or seized. Instead, infrastructure needs constant maintenance investment forever. That’s the shape of a liability, not an asset.
It’s easy to approve suburban sprawl when the financial costs are obscured, even if unintentionally.
Adopt The Strong Towns Approach
What’s a Sacramento leader to do? How do you plan to raise the $85M/year minimum needed to avert pothole-pocalypse? Will you allocate it from the general fund? Will you champion a $500/year tax on every household in the city? Will you just kick the can down the road and defer the maintenance again?
Or will you adopt the Strong Towns approach and take steps to reverse Sacramento’s Suburban Experiment?

Strong SacTown was part of ending parking mandates and single-family-exclusive zoning citywide back in 2024, and we are continuing our advocacy today to shape mixed-use zoning and other policies. Join us if you haven’t already, and please take a look at our priorities for a stronger Sacramento!
Footnotes
- The Finance Decoder spreadsheet for Sacramento with all input values filled in.
- 2014 and earlier metrics use an adjusted “Total Liabilities” (from MD&A Section) based on adding unfunded pension liabilities to the official Total Liabilities value. This is meant to compensate for GASB 68 requirements taking effect only from 2015 onward, changing how Total Liabilities is calculated.