See our Instagram post here!
We Have A Problem
The City of Sacramento is developing its budget for fiscal year 2024/2025 and has forecasted significant financial challenges. In order to achieve a balanced budget, Sacramento is faced with an all-too-common dilemma for cities across America: cut services today, or accumulate more debt and pay later. Today’s dilemma is unfortunately not new to Sacramento, which accumulates about $600-700M of debt every year for at least the last 10 years.
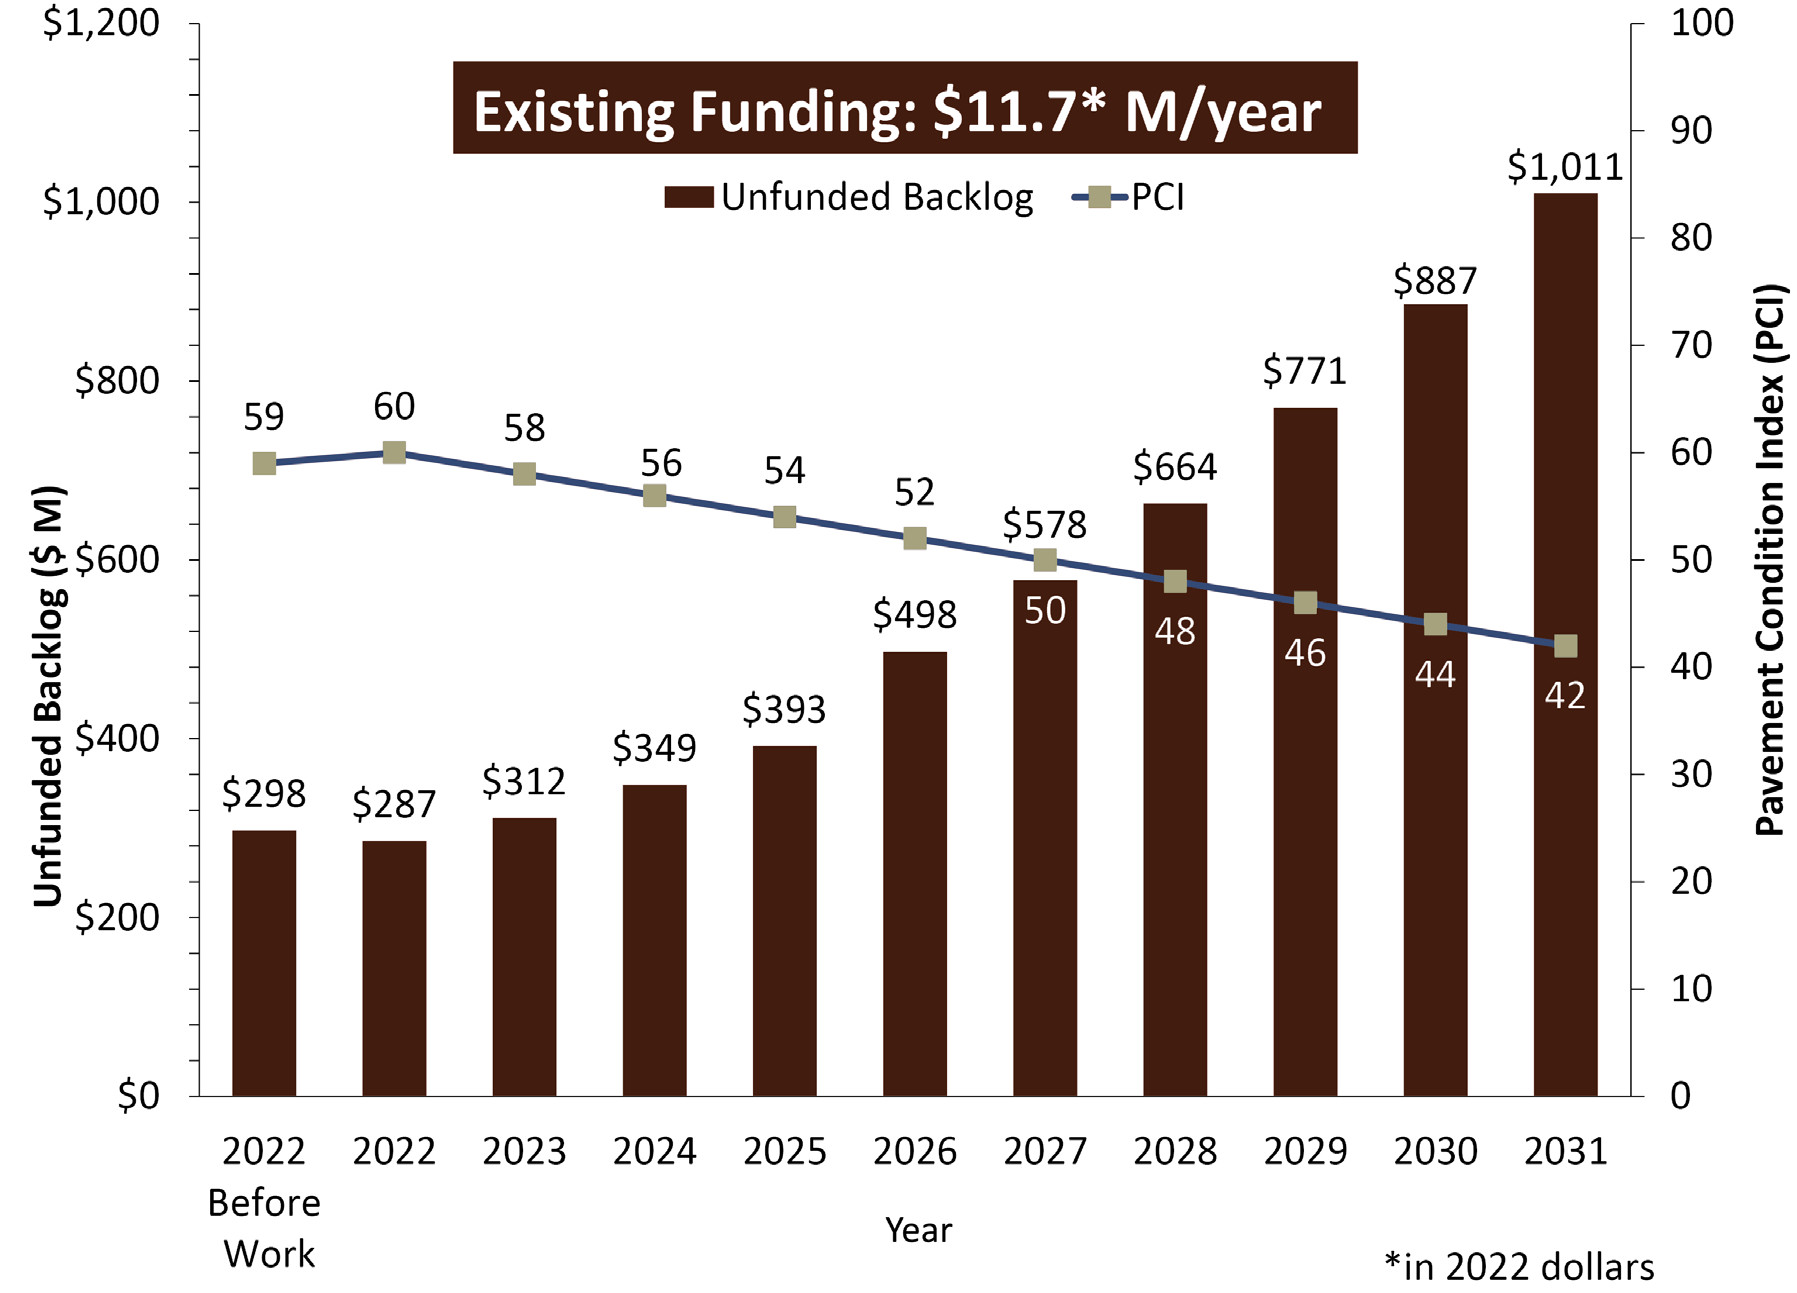
Debt can be difficult to quantify because it can take many shapes besides bonds and pensions. For example, when we cut funding to road maintenance, debt is accumulated in the form of potholes experienced by residents today and exponentially more costly repairs for public works later. When we defer maintenance of our urban tree canopy and trees are lost, residents bear a greater burden of hot summer temperatures and increased flood risk. Budget cuts for school bus drivers may result in fewer, more distant pickup locations, which increases rates of student tardiness and potentially impacts learning performance and outcomes later in life. Every year Sacramento is forced to decide which services to cut and where to assume debt in order to balance the budget. This process is ideally democratic, but inevitably there will be winners and losers.
Financial solvency in a city is achieved only when revenue regularly meets or exceeds expenses, and deferred maintenance is minimized or eliminated. This allows conditions to improve for all residents, improving livability and equity. However, Sacramento is financially insolvent, and in order to understand why we need to look to the suburbs.
Suburbs Are Financially Insolvent
Over the last 70 years the suburban experiment has enveloped over 90% of the city’s built-up area, but unfortunately suburban development is financially insolvent since it cannot generate enough local taxes to pay for the services it requires.
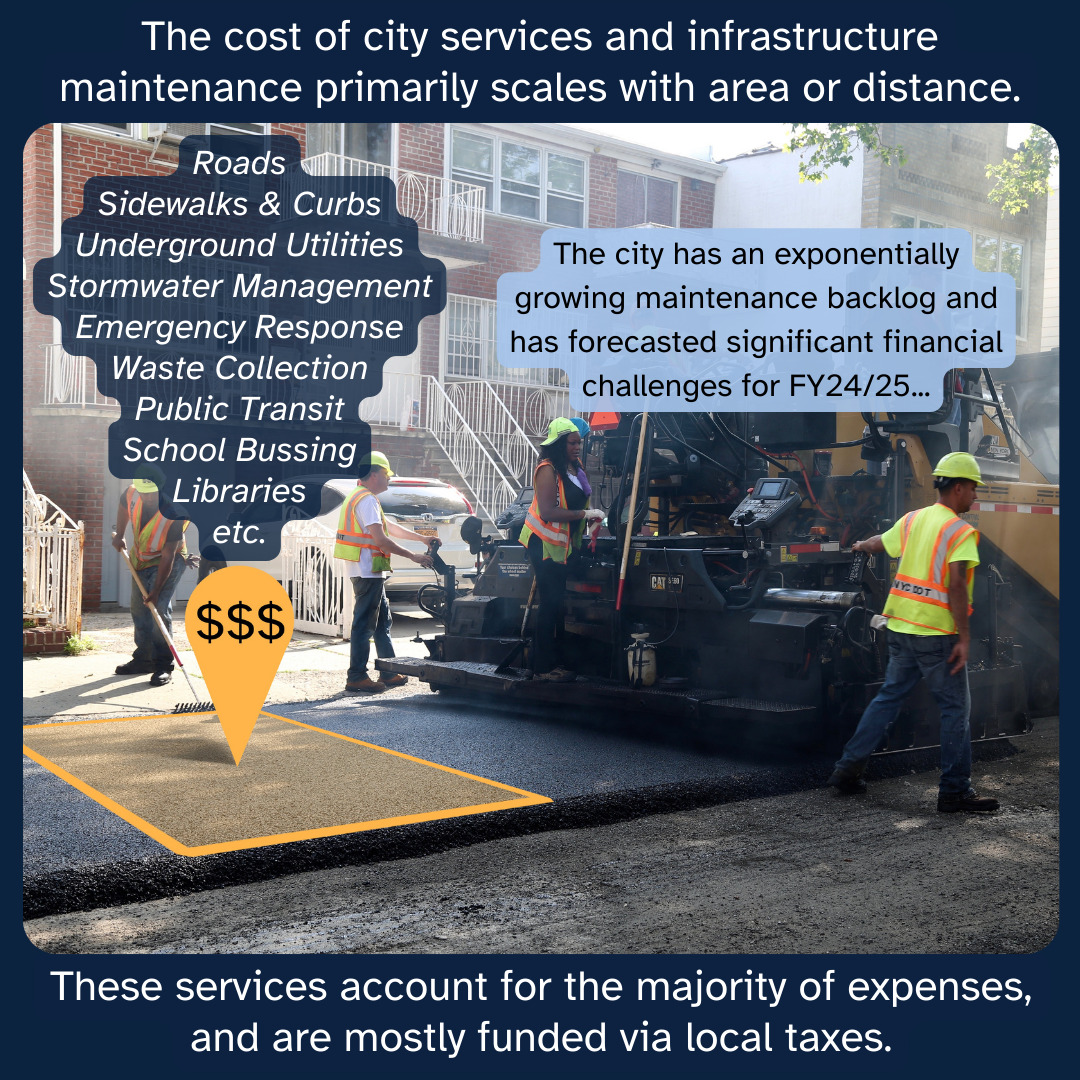
Before we look at specific examples, we first need to understand two key facts. First, the cost of city services and infrastructure maintenance primarily scales with the amount of area served. Here are just a few examples:
| Service | Dominant Drivers of Maintenance/Operational Costs |
|---|---|
| Water | Miles pumped & number of properties served |
| Storm & Waste Water | Acres of impervious surface & miles of underground utility |
| Roads | Lane-miles of asphalt |
| Sidewalks & Curbs | Linear feet of sidewalk |
| Fire | Number of fire stations staffed (via salaries & benefits) & number of fire hydrants |
| Libraries | Number of libraries staffed (via salaries & benefits) |
| Public Transit | Total miles across all lines & service frequency (via salaries & benefits) |
The second key fact is that in Sacramento these costs are mostly recovered via local taxes, such as property and sales taxes. Therefore, the tax revenue density of a neighborhood is a key indicator of financial solvency.
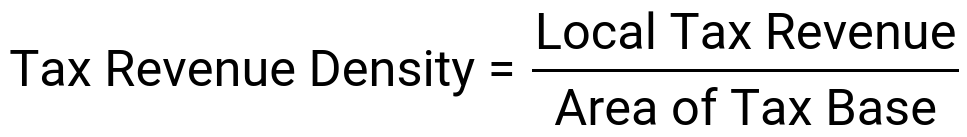
Let’s compare the tax revenues of same-size blocks from two different neighborhoods:
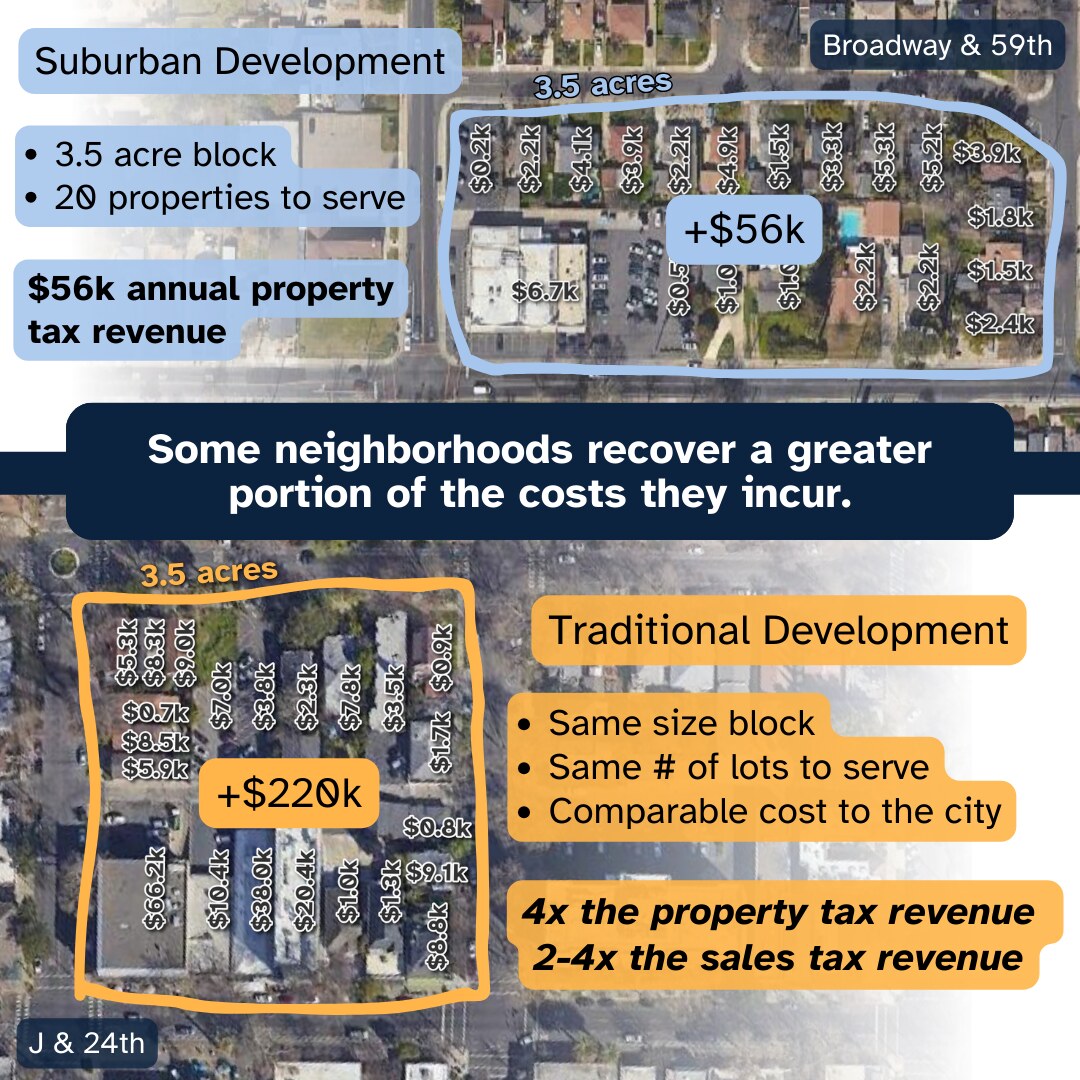
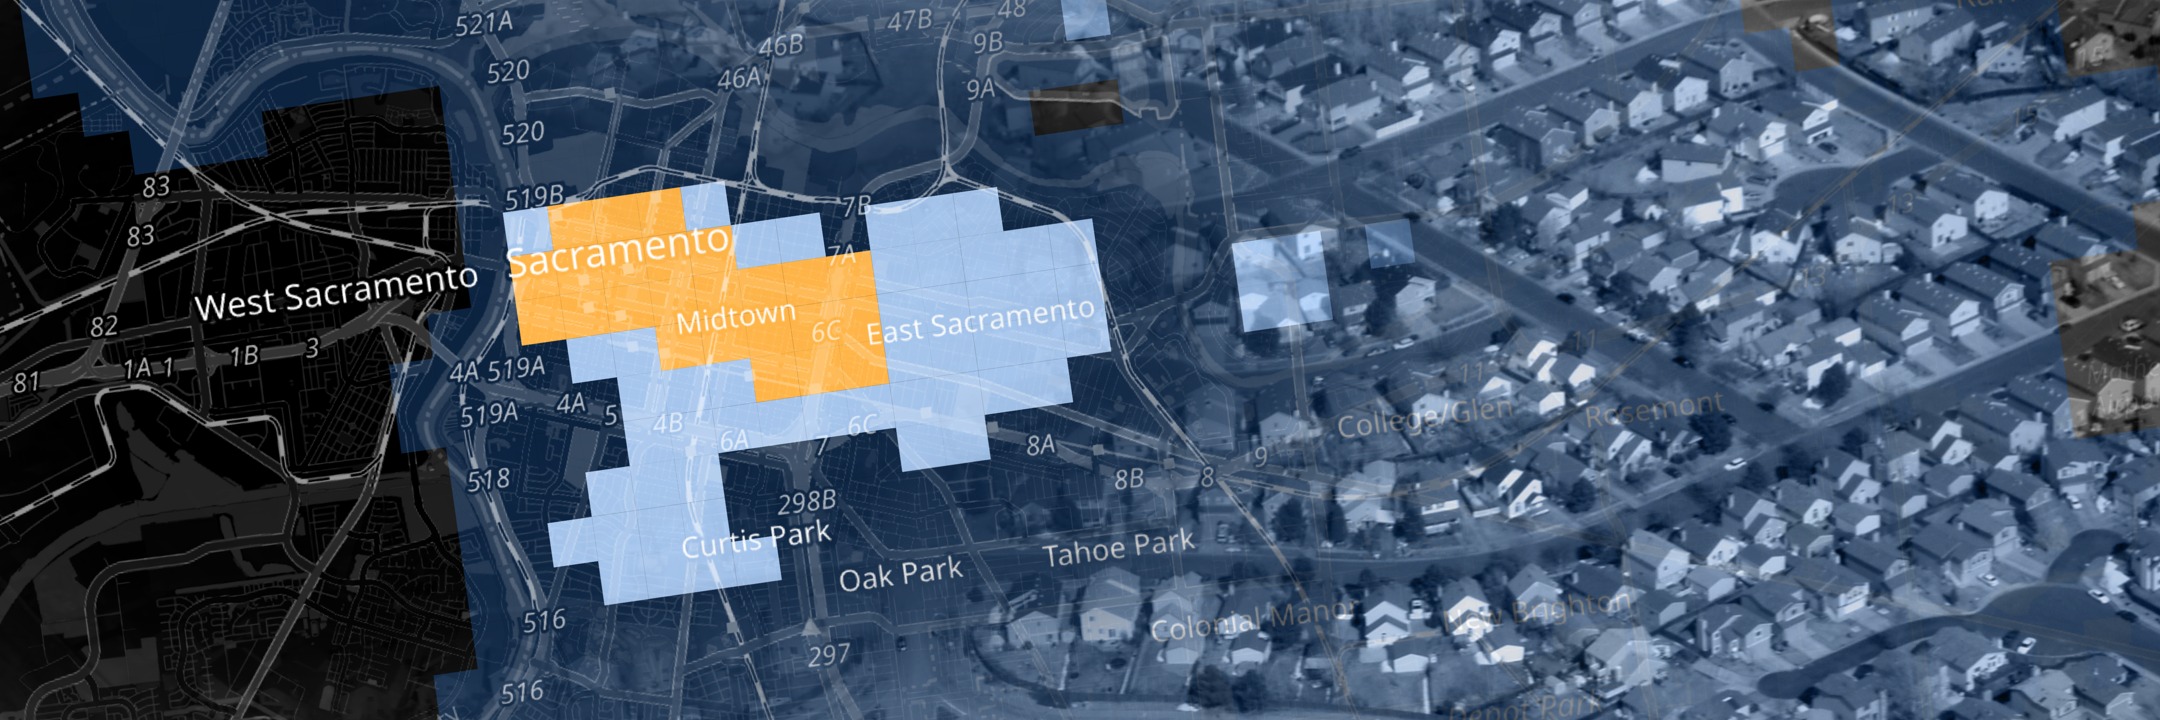
Suburban development produces the lowest tax revenue density, making it the most expensive development pattern for a city to support. The 3.5-acre block of traditional development in Midtown generates 4x as much property taxes as the same-size block of suburban development in Tahoe Park. Furthermore, the Midtown block contained 3x the number of retail shops (sales tax revenue), one office building (business tax revenue), and 10 parking meters (fees revenue).
This tax revenue disparity might not be an issue if not for the fact that the city is in a perpetual state of financial crisis1. The financial precarity of suburban development makes cities like Sacramento extremely fragile in the face of other, less predictable challenges, such as corruption or the 2008 financial crisis (a key factor that led to Stockton, CA declaring Chapter 9 bankruptcy in 2012). Sacramento’s Central City is such a hot spot of tax productivity that it carries a disproportionately greater tax burden, staving off total financial collapse.
Suburbs can’t pay for themselves, and the tax density of the Central City helps subsidize them.
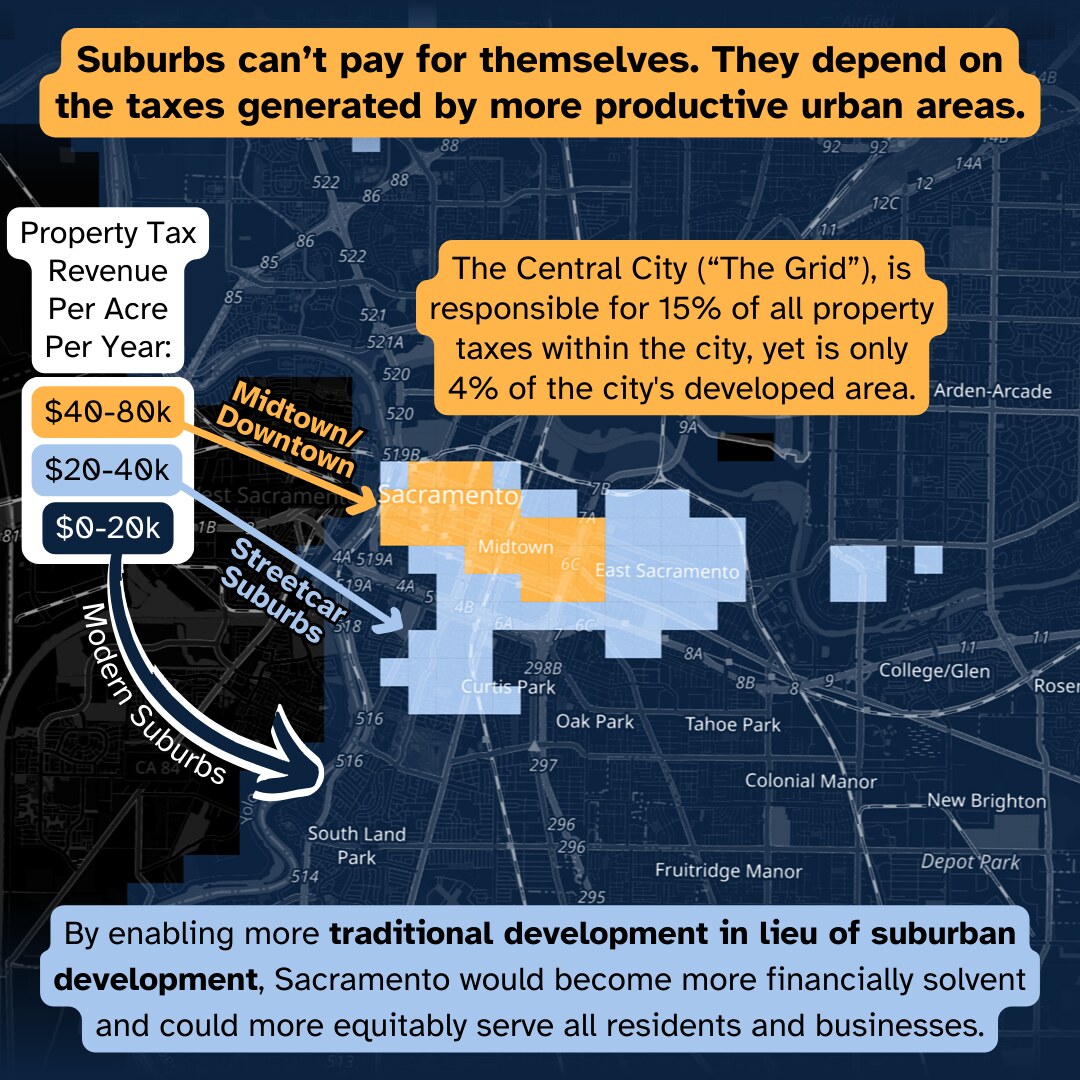
According to our analysis of Sacramento County’s property assessment roll data, some neighborhoods have a property tax density 4-5x the citywide average2. These high tax-dense neighborhoods all have something in common. In order to understand how to make Sacramento financially solvent, we need to look to the central city.
Traits of Traditional Development
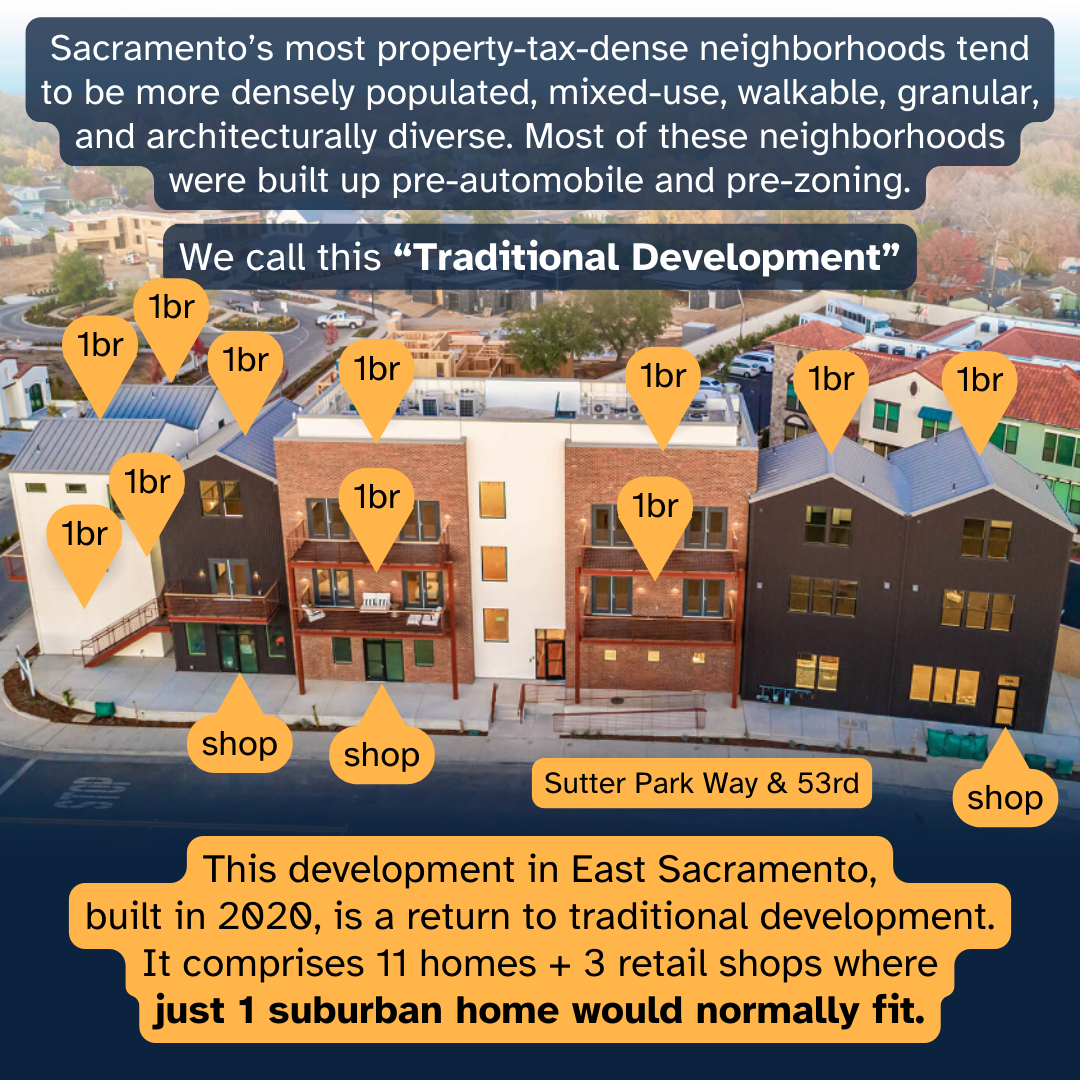
Traditional development looks complex, three-dimensional, connected, functional, diverse, dense but not overcrowded, walkable, fine-grained, and human-scaled. At times, it can look unfinished, but that is because it embraces change and can adapt to the ever-evolving needs of a city. But most importantly, traditional development is highly productive.
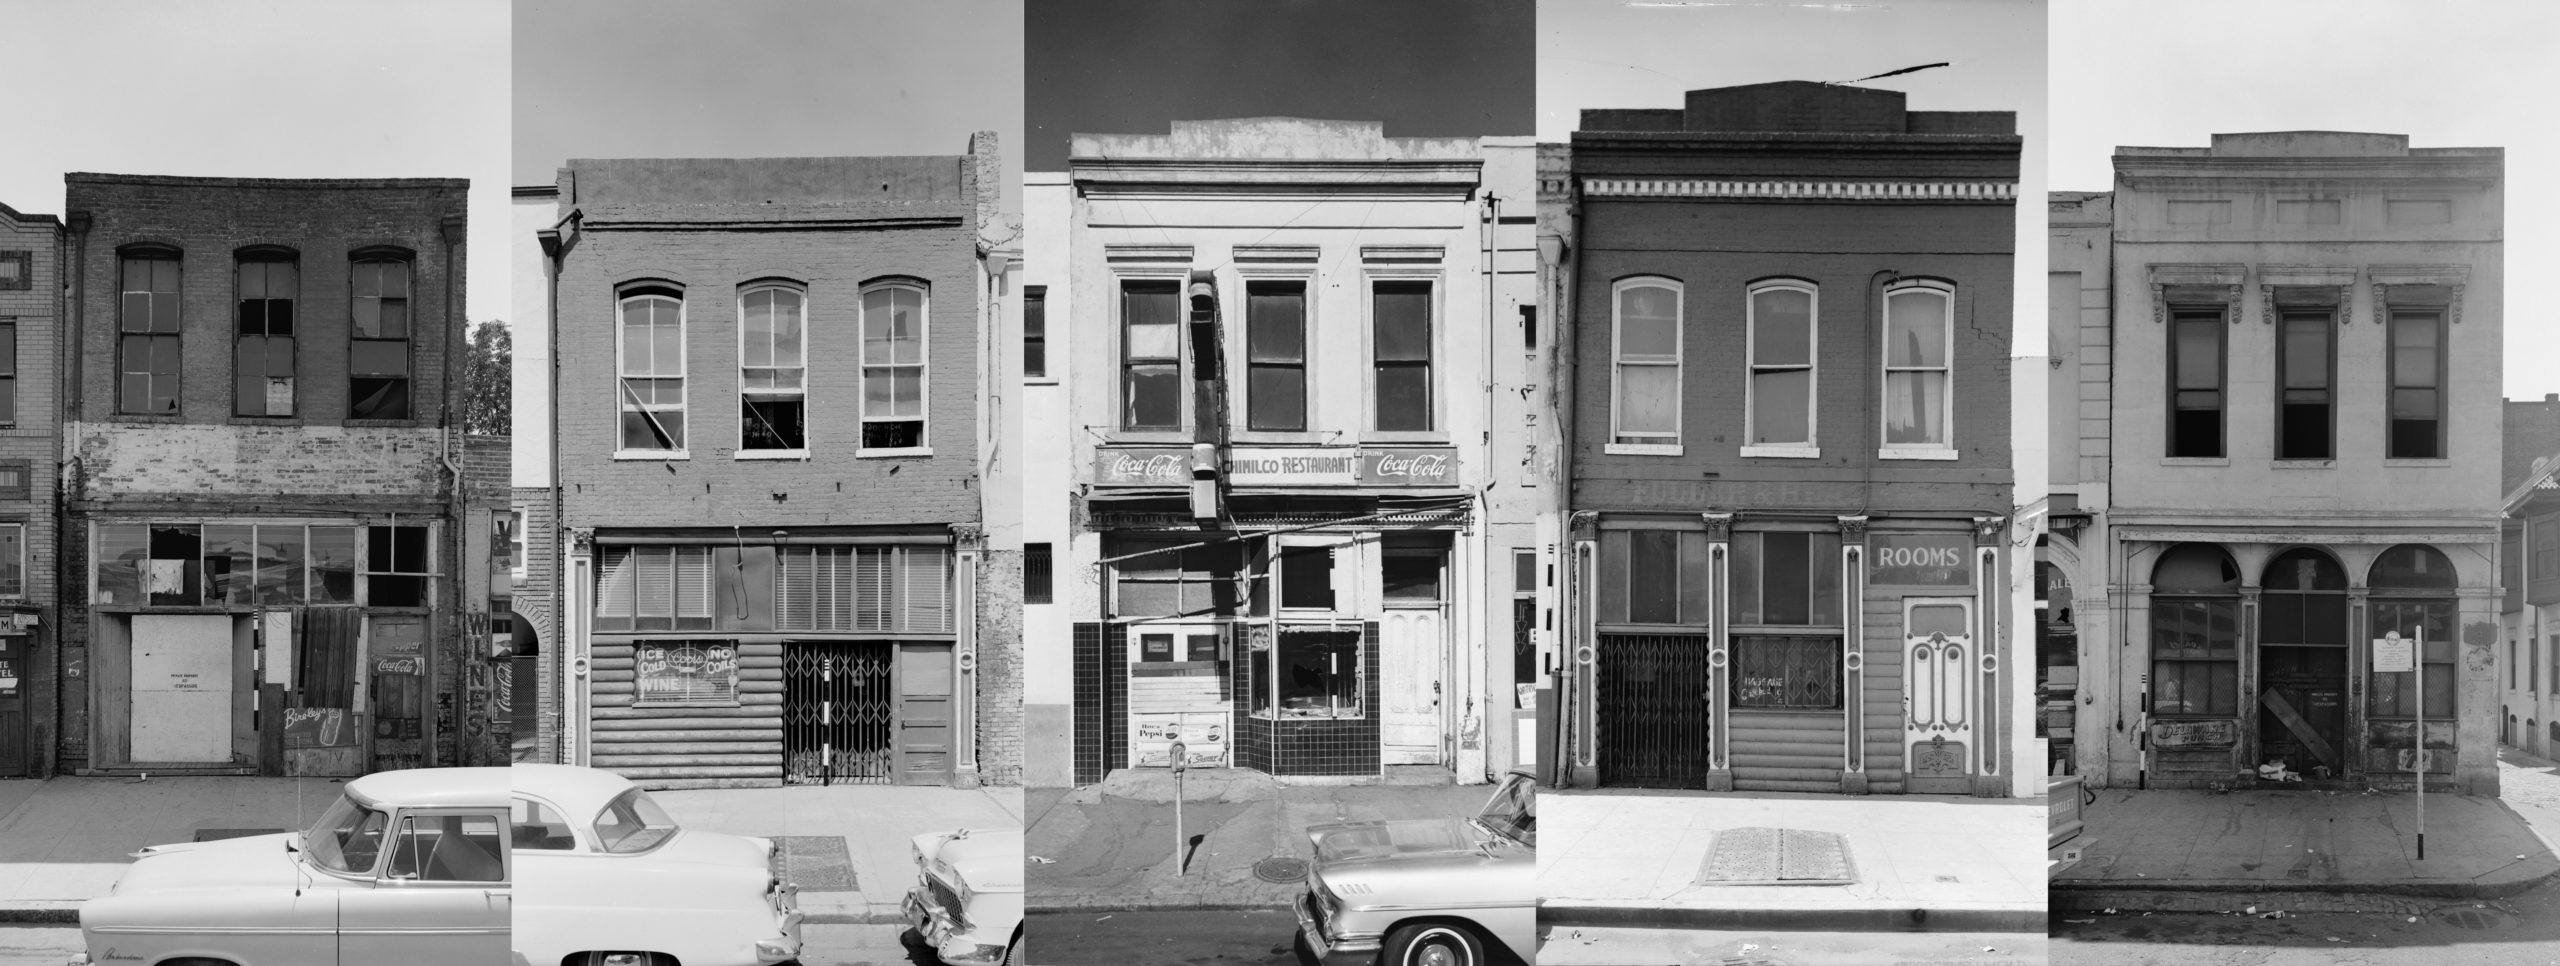
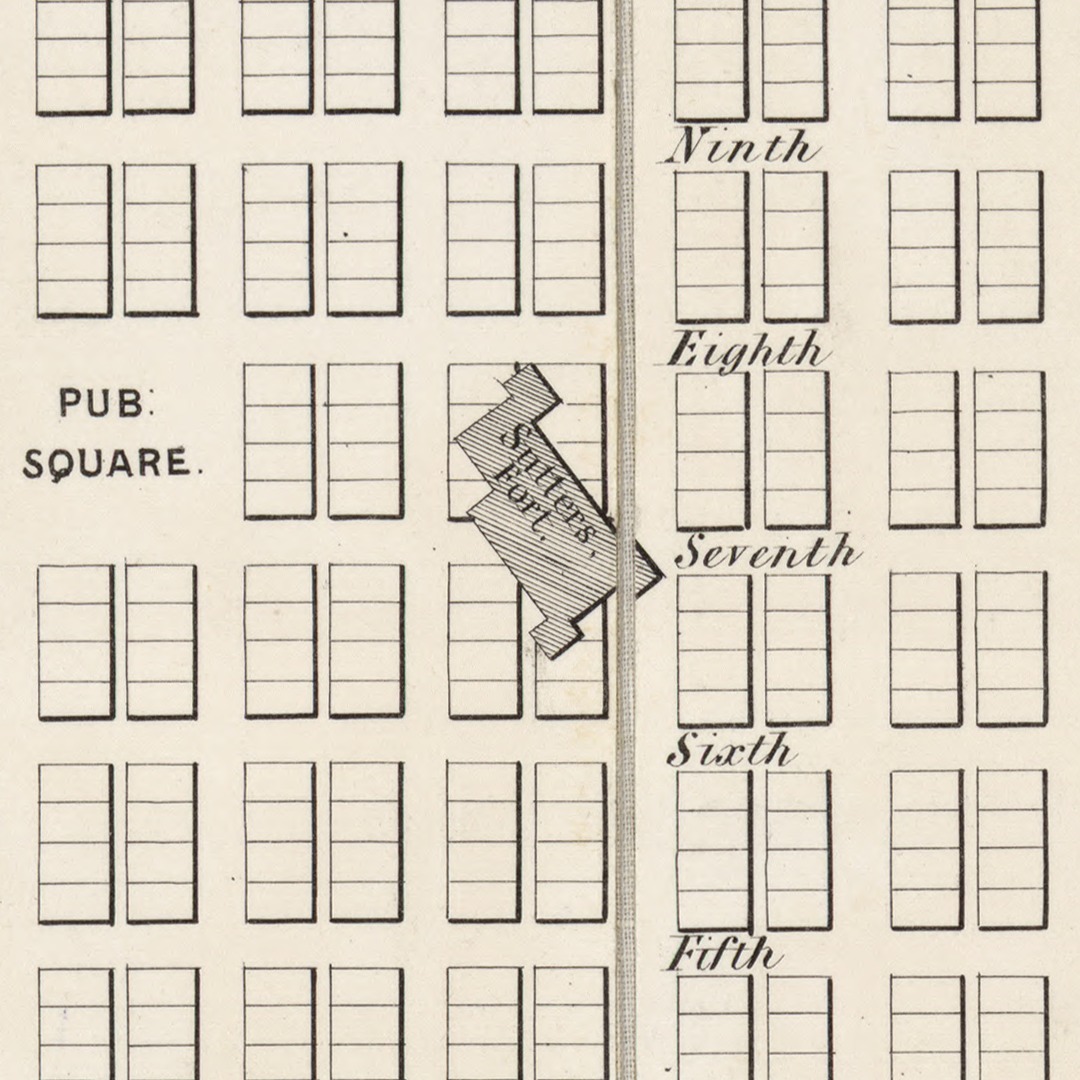
Another way to study traditional development in Sacramento is to look at archival photographs of buildings that were razed in the 1950s to make way for the I-5 freeway through Downtown. Note the mix of different business types, including hotels, bars, shops, restaurants, and apartments. Also note the pattern of “attached” buildings where adjacent buildings share walls, owing to the fact that side-yard setbacks were not yet mandated.
So how do we get on track to financial solvency and end the suburban experiment? This starts with understanding the link between tax density and specific development pattern indicators.
Indicators of Traditional Development: Zoning
Traditionally, the use of a building was completely up to the owner to decide. Prior to zoning, no law dictated how many families could live under one roof, whether a bodega was a permitted use, or how many off-street parking stalls were required per lane of a bowling alley.
Since the adoption of zoning over 70 years ago, the majority of Sacramento’s development has been limited to one family per roof, no bodegas allowed, and five parking stalls per lane in a bowling alley, among many other zoning-imposed restrictions. This has contributed to longer walking distances between destinations that are more segregated by use and more separated by seas of parking.
But that’s not where the problems end.
Indicators of suburban development such as no mixed-use buildings and no multi-family buildings are also correlated with low tax density, something which we know contributes to Sacramento’s overall debt:
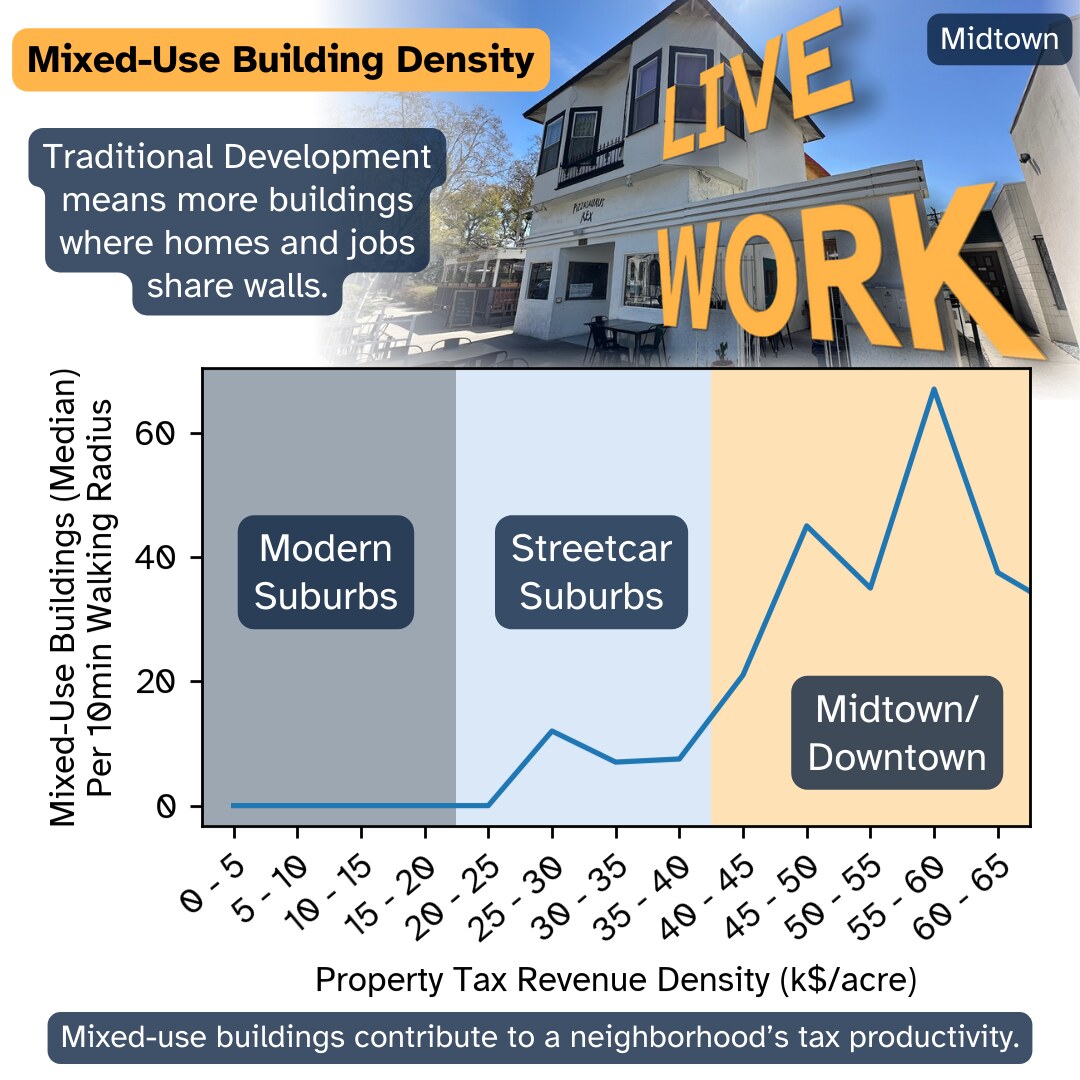
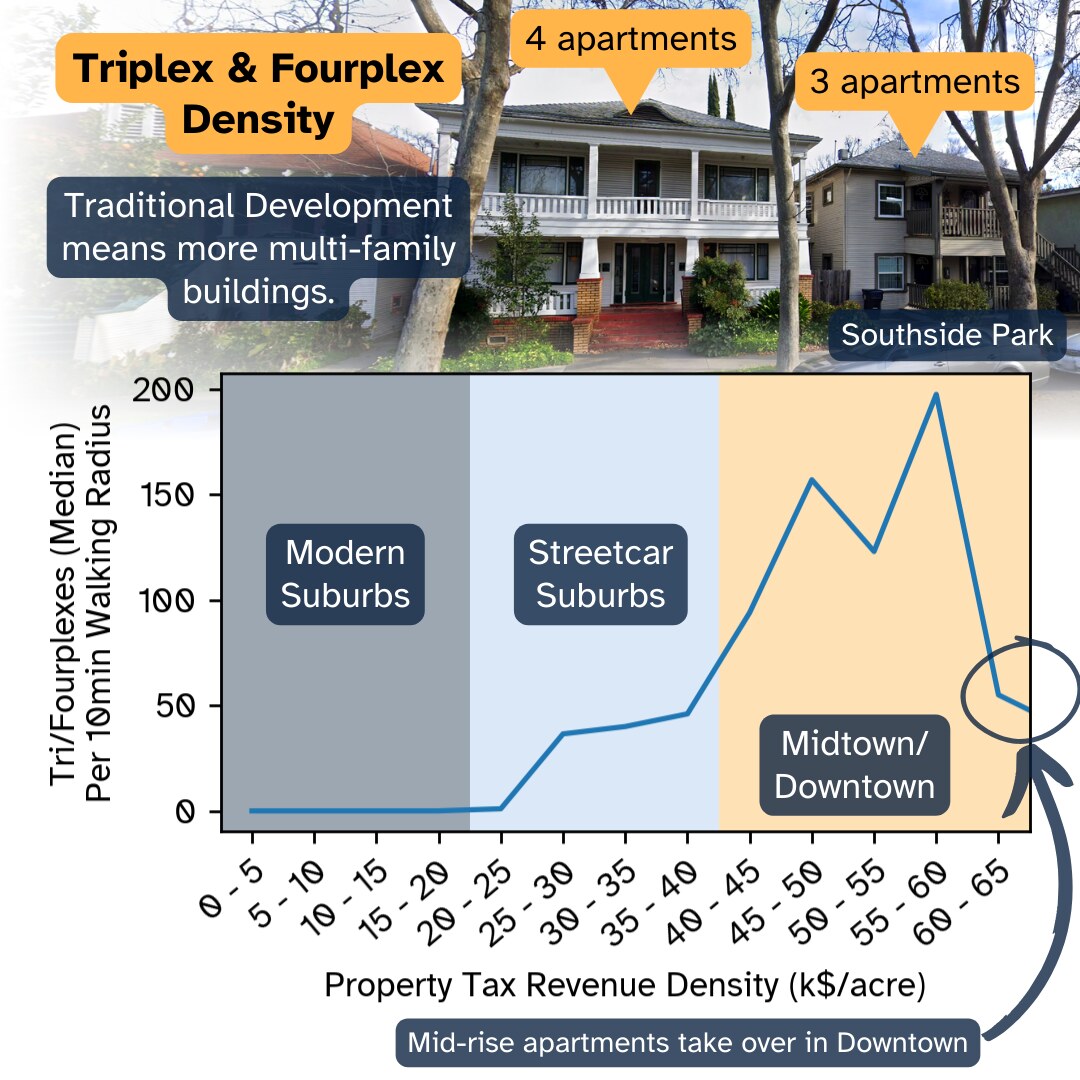
Mixed-use buildings and multi-family buildings are abundant in high tax-dense neighborhoods above $40k/acre, where one could likely reach over 40 mixed-use buildings and over 150 tri/fourplexes all within a 10 minute walk. Conversely, these building types are almost completely absent in neighborhoods below $20k/acre. It should not come as a surprise that these building types are abundant wherever zoning has not banned them, but our research goes one step further and directly links these building types with higher tax densities.
Indicators of Traditional Development: Platting
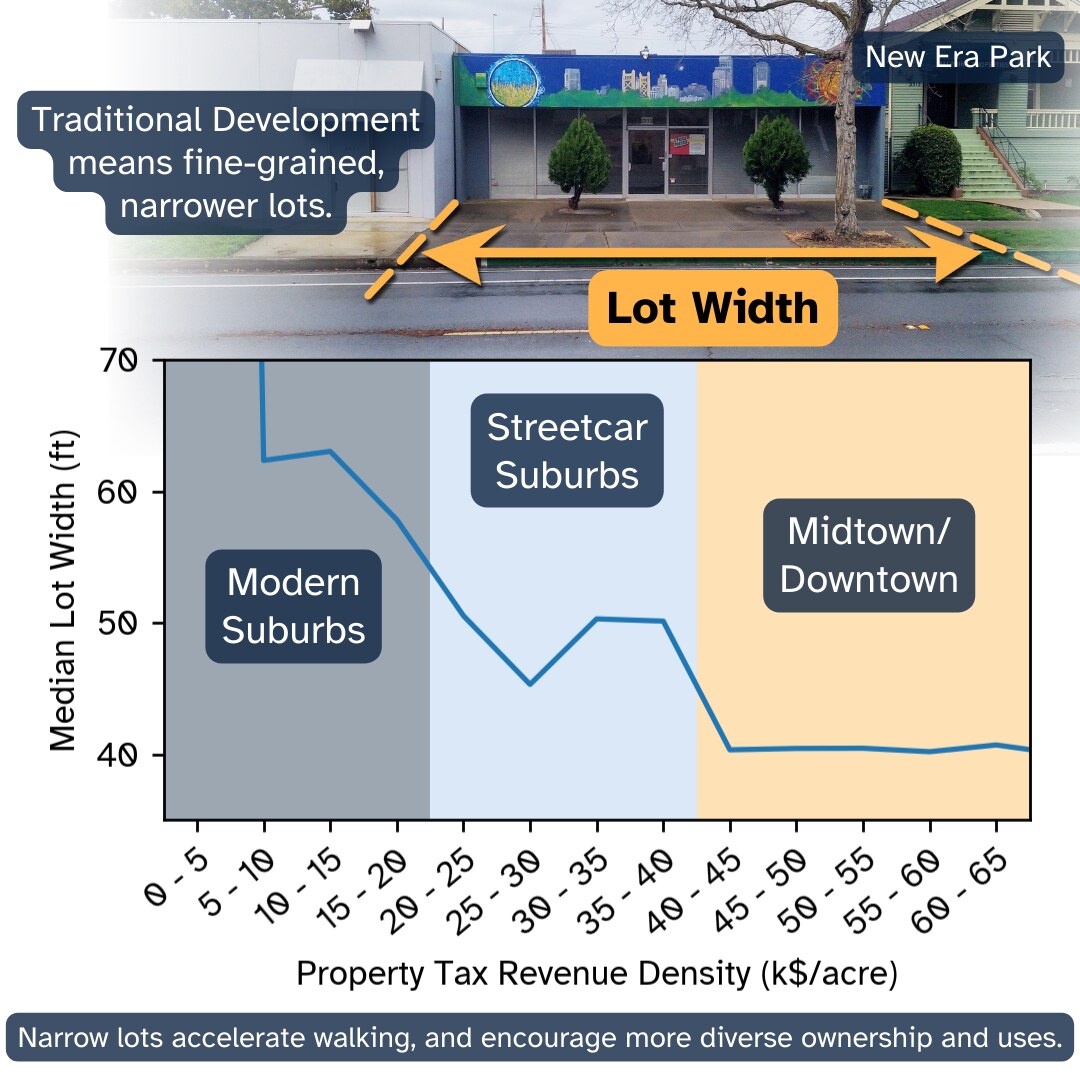
Platting is the practice of subdividing property into multiple smaller lots, often also drawing the streets and alleys. Traditionally, streets were drawn to a dense grid, and lots were drawn narrow. This resulted in the walkable gridded layout of Sacramento’s central city, which reduces distances between any two destinations. The relatively narrow 40-ft lots also give pedestrians a greater diversity of destinations and encourage developers to utilize space more efficiently.
However, the suburban experiment changed that basic platting formula for nearly every new development since the 1940s. New suburban-style plats introduced wider lots, and the infamous cul-de-sac (a more favorable name for dead end street). These have resulted in coarse-grained urbanism, less direct paths to destinations, and overall poor walkability.
But that’s not where the problems end.
Indicators of suburban development such as wide lots and low intersection density are also correlated with low tax density:

Zoning Reform Is In The Air
It might sound like we are calling for zoning abolition and an immediate return to traditional development. After all, didn’t zoning largely get us into this financial mess in the first place?

On the contrary, we believe that zoning abolition might be the wrong choice because no neighborhood should ever be subject to extreme change. Zoning reform with zoning abolition as a guiding star can instead help ween us off of the failed suburban experiment over the course of multiple decades. We hope this incremental approach will be less prone to political relapse, and less likely to cause gentrification and displacement.

In 2023, Strong SacTown, alongside many other groups like House Sacramento, mobilized members to comment on Sacramento’s draft 2040 General Plan. We called for the elimination of parking minimums, higher residential density near transit, development of Safe Routes To School programs, and overall prioritization of pedestrians and housing over cars. We got everything we asked for, and the document was officially adopted in February 2024! Did I mention that it also ended single-family exclusive zoning? Times are changing, and zoning reform is favorable among residents, city staff, planning commissioners, and councilmembers alike. It may take a long time to unwind a half century of car-centric planning decisions, but I’d say Sacramento is off to a great start!
See also
- Halifax Regional Municipality – Settlement Pattern and Form with Service Cost Analysis
- City Of Sacramento – Approved Budget 2020-2021
- Strong Towns – What is Traditional Development?
- Strong Towns – Fine-Grained vs. Coarse-Grained
- Strong Towns – The Real Reason Your City Has No Money
- Strong Towns – The Question Every City Should Be Asking (about value-per-acre)
- Strong Towns – We Could Solve a Lot of Our Problems if We Just Built the Way We Used To
- Strong SacTown – The Cost of Road Maintenance
Footnotes
- Multiple times during the last 70 years, Sacramento resorted to federally subsidized suburban expansion to create temporary financial relief in a cycle known as the Growth Ponzi Scheme, but this cycle is only a bandaid solution to financial crisis and only kicks the can down the road.
- My methodology of calculating a property tax density heatmap is summarized below:
- Property assessment roll data is joined to tax rate area data to calculate tax revenue per parcel.
- Result is joined to parcel geometries to establish the geographic location of tax revenues.
- A point grid (500 meter resolution) is generated across city.
- A circle grid of 1600 meter diameter circles is generated using the point grid as centroids. Each circle represents a 10-minute walking radius tax base.
- For each tax base circle, calculate the sum of property tax revenue, and also calculate the sum of developable land area (including both private property and public right of ways).
- Finally, for each tax base circle, calculate the property tax revenue density = (property tax revenue) / (sum of developable land in acres).